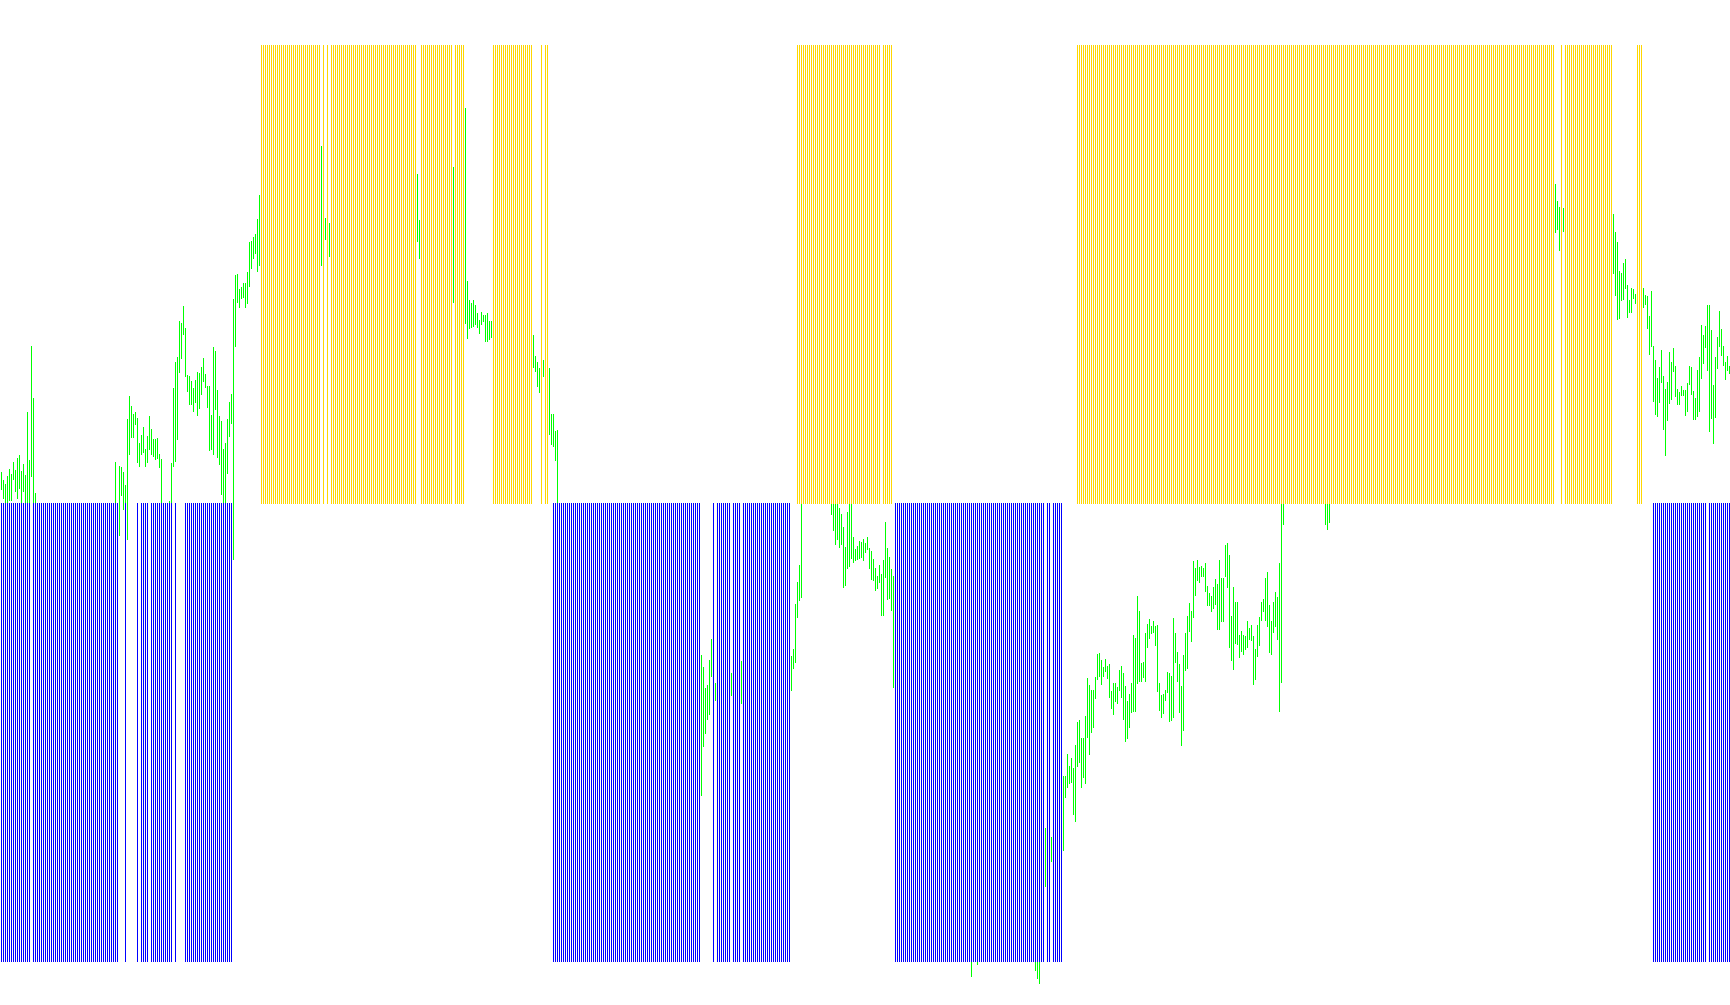
This tool is designed as a visual filter for traders who use the Relative Strength Index (RSI) to identify market momentum. Its primary purpose is to simplify the interpretation of price action by categorizing market trends into clear "Up" and "Down" signals based on specific mathematical thresholds.
Core Logic and Functionality
The script analyzes the RSI value—a common indicator used to measure the speed and change of price movements—and applies a multi-stage filtering logic to determine the prevailing trend:
1. Trend Identification (The Trigger) The script constantly monitors the RSI values. It establishes a primary "trigger" based on extreme market conditions:
- If the RSI rises above 70, the script identifies a potential strong upward momentum.
- If the RSI falls below 30, the script identifies a potential strong downward momentum.
2. Confirmation Zones (The Filter) Unlike standard indicators that might give signals immediately, this script uses a "confirmation zone" to ensure the trend is stable before displaying a visual signal:
- For Upward Trends: Once an upward trigger is activated, the tool only shows a positive signal if the RSI remains above 40. This prevents the indicator from showing a "buy" bias during weak rallies.
- For Downward Trends: Once a downward trigger is activated, the tool only shows a negative signal if the RSI remains below 60. This ensures that the "sell" bias is maintained unless the market shows significant recovery.
Visual Representation
Instead of providing a complex web of lines or numbers, the script translates this logic into a clean histogram:
- Upward Signal: Represented by a positive bar (SkyBlue) indicating a confirmed bullish trend.
- Downward Signal: Represented by a negative bar (Orange) indicating a confirmed bearish trend.
Summary for the User
In practical terms, this script acts as a "noise filter." It helps traders ignore minor price fluctuations and focuses on periods where the market is showing sustained strength in one direction. By requiring the RSI to stay within specific boundaries after a major move, it aims to provide a clearer picture of the current market environment, helping you distinguish between a temporary spike and a continuing trend.
/*-----------------------------+
|			       |
| Shared by www.Aptrafx.com    |
|			       |
+------------------------------*/

//+------------------------------------------------------------------+
//|                                                 RSIFilter_v1.mq4 |
//|                                  Copyright © 2006, Forex-TSD.com |
//|                         Written by IgorAD,igorad2003@yahoo.co.uk |
//|            http://finance.groups.yahoo.com/group/TrendLaboratory |
//+------------------------------------------------------------------+
#property copyright "Copyright © 2006, Forex-TSD.com "
#property link      "http://www.forex-tsd.com/"

#property indicator_separate_window
#property indicator_minimum -2
#property indicator_maximum 2
#property indicator_buffers 2
#property indicator_color1 SkyBlue
#property indicator_color2 Orange

//---- input parameters
extern int PeriodRSI=14;
//---- indicator buffers
double UpBuffer[];
double DnBuffer[];
//+------------------------------------------------------------------+
//| Custom indicator initialization function                         |
//+------------------------------------------------------------------+
  int init()
  {
   string short_name;
//---- indicator line
   SetIndexStyle(0,DRAW_HISTOGRAM,STYLE_SOLID,1);
   SetIndexStyle(1,DRAW_HISTOGRAM,STYLE_SOLID,1);
   SetIndexBuffer(0,UpBuffer);
   SetIndexBuffer(1,DnBuffer);
   IndicatorDigits(MarketInfo(Symbol(),MODE_DIGITS));
//---- name for DataWindow and indicator subwindow label
   short_name="RSI Filter("+PeriodRSI+")";
   IndicatorShortName(short_name);
   SetIndexLabel(0,"UpTrend");
   SetIndexLabel(1,"DownTrend");
//----
   SetIndexDrawBegin(0,PeriodRSI);
   SetIndexDrawBegin(1,PeriodRSI);
//----
   return(0);
  }

//+------------------------------------------------------------------+
//| RSIFilter_v1                                                         |
//+------------------------------------------------------------------+
int start()
  {
   int shift,trend;
   double RSI0;


   for(shift=Bars-PeriodRSI-1;shift>=0;shift--)
   {
   RSI0=iRSI(NULL,0,PeriodRSI,PRICE_CLOSE,shift);

	  if (RSI0>70)  trend=1;
	  if (RSI0<30)  trend=-1;

	  if (trend>0)
	  {
	  if (RSI0 > 40) UpBuffer[shift]=1.0;
	  else UpBuffer[shift] = EMPTY_VALUE;
	  DnBuffer[shift]=0;
	  }
	  if (trend<0)
	  {
	  if (RSI0 < 60) DnBuffer[shift]=-1.0;
	  else DnBuffer[shift] = EMPTY_VALUE;
	  UpBuffer[shift]=0;
	  }
	}
	return(0);
 }
Comments