super-signals_Test
Download script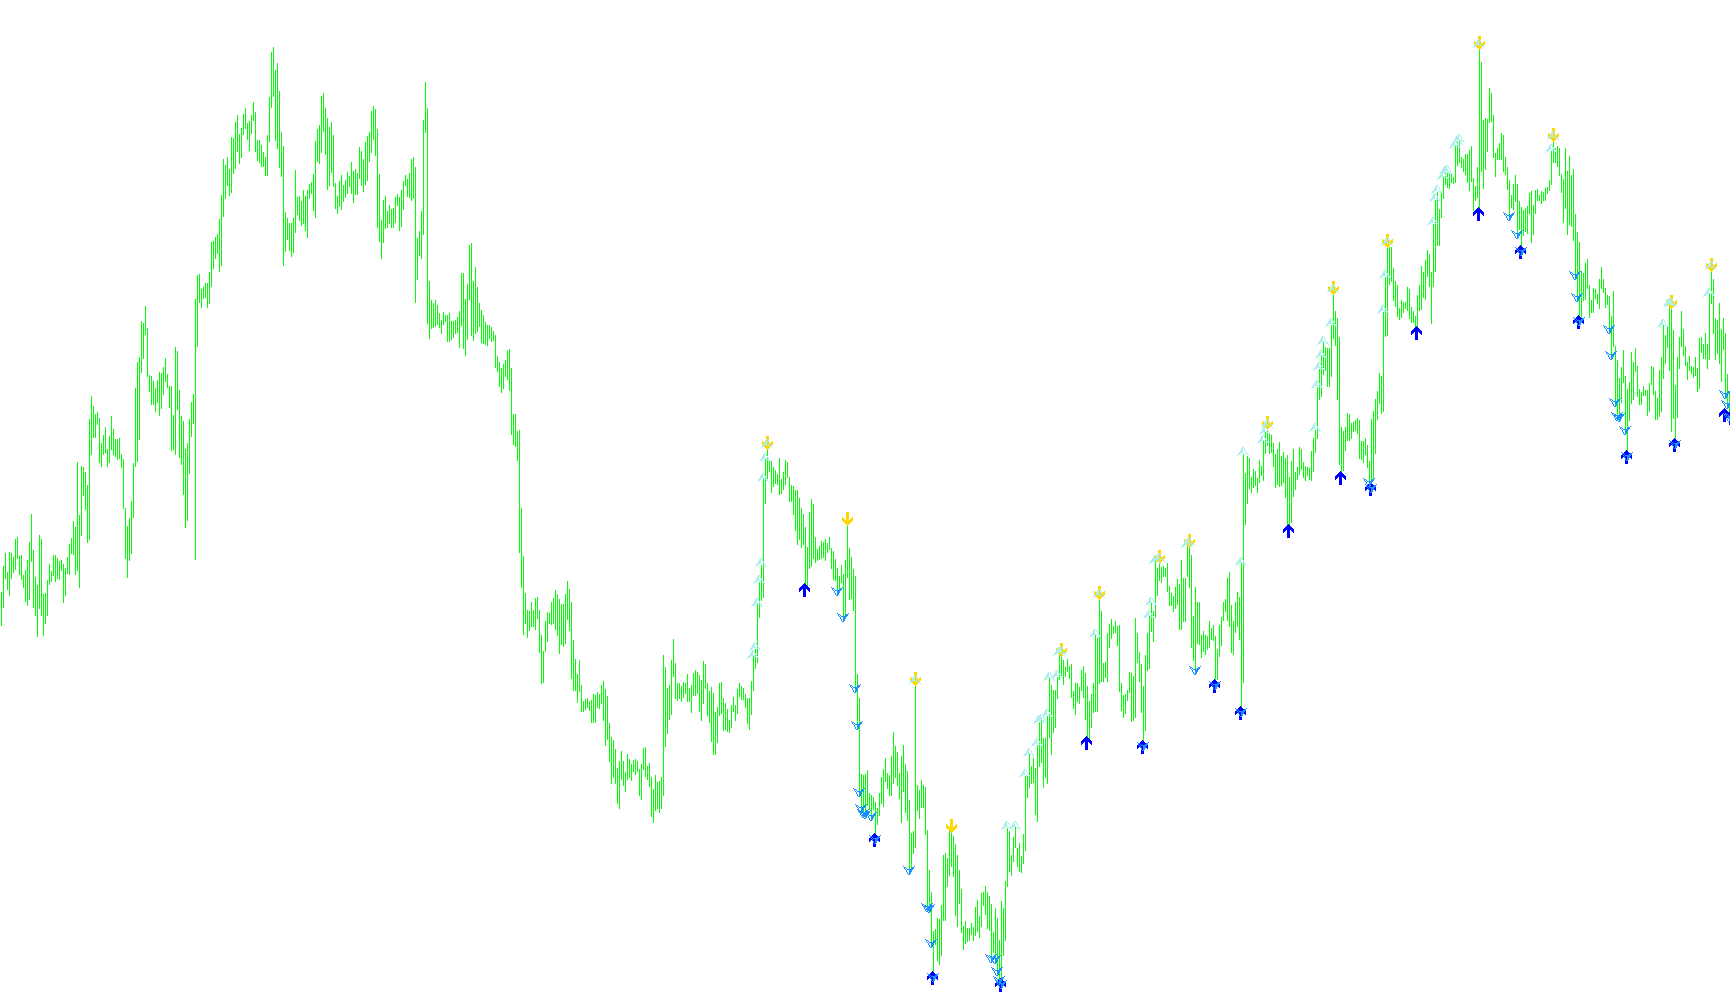
This tool is designed as a visual aid for traders to identify significant price action by highlighting historical peaks and troughs on a chart. Rather than following complex mathematical formulas or moving averages, the logic relies on identifying "local extremes"—the highest and lowest points within a specific window of time.
How it Works
The script scans the price history back over a set number of candles (determined by the user settings) to analyze the price movement. For every point in that history, it looks at a small surrounding neighborhood of bars to determine where the "peaks" and "valleys" are located.
Key Functionalities
- Peak & Trough Identification: The tool automatically scans for the highest price points (resistance areas) and the lowest price points (support areas) within a fixed range.
- Visual Signaling: When the script identifies one of these local highs or lows, it places a visual marker (an arrow) on the chart. This allows traders to quickly see where significant price reversals or momentum shifts have occurred in the past.
- Dual-Layer Analysis: The logic performs two distinct types of scans simultaneously. It looks for the absolute highest and lowest points relative to the current bar's neighborhood, while also tracking a secondary set of extremes. This provides a more comprehensive view of price fluctuations, helping distinguish between major structural turns and smaller price wobbles.
- Customizable Spacing: The tool includes a "Gap" feature, which ensures that the visual markers are placed at a slight distance above or below the actual candle wicks. This prevents the icons from overlapping with the price bars, ensuring the chart remains clean and easy to read.
Summary for the User
In simple terms, this script acts as an automated highlighter. It combs through your trading history and "tags" every major high and low it finds. By using these markers, you can more easily visualize the structural "skeleton" of the market, making it easier to spot where price has historically turned around or reached a limit.
//+------------------------------------------------------------------+
//|                                                super-signals.mq4 |
//|                Copyright © 2006, Nick Bilak, beluck[AT]gmail.com |
//+------------------------------------------------------------------+
#property copyright "Copyright © 2006, Nick Bilak"
#property link      "http://www.forex-tsd.com/"

#property indicator_chart_window
#property indicator_buffers 4
#property indicator_color1 Red
#property indicator_width1 2
#property indicator_color2 Lime
#property indicator_width2 2
#property indicator_color3 Yellow
#property indicator_width3 2
#property indicator_color4 Brown
#property indicator_width4 2

extern int SignalGap = 4;
extern int BarsToCount = 500;

int OneInitOnly=true;

int dist=24;
double b1[];
double b2[];
double b3[];
double b4[];

int init()
  {
   SetIndexStyle(0,DRAW_ARROW,STYLE_SOLID,1);
   SetIndexArrow(0,234); //234
   SetIndexBuffer(0,b1);

   SetIndexStyle(1,DRAW_ARROW,STYLE_SOLID,1);
   SetIndexArrow(1,233); //233
   SetIndexBuffer(1,b2);

   SetIndexStyle(2,DRAW_ARROW,STYLE_SOLID,1);
   SetIndexArrow(2,217);
   SetIndexBuffer(2,b3);

   SetIndexStyle(3,DRAW_ARROW,STYLE_SOLID,1);
   SetIndexArrow(3,218);
   SetIndexBuffer(3,b4);

   if(OneInitOnly==true)
     {
      int i;
      OneInitOnly=false;
      for (i=BarsToCount;i>=0;i--)
        {
         b1[i]=EMPTY_VALUE;
         b2[i]=EMPTY_VALUE;
         b3[i]=EMPTY_VALUE;
         b4[i]=EMPTY_VALUE;
        }
     }
  }

int start() {
   int k,i,j,limit,hhb,llb, hhb2, llb2;

   for (i=BarsToCount;i>=0;i--)
     {
      hhb = iHighest(Symbol(),0,MODE_HIGH,dist,i-dist/2);
      llb = iLowest(Symbol(),0,MODE_LOW,dist,i-dist/2);
      hhb2 = iHighest(Symbol(),0,MODE_HIGH,dist,i);
      llb2 = iLowest(Symbol(),0,MODE_LOW,dist,i);

      if (i==hhb) b1[i]=High[hhb]+SignalGap*Point;
      if (i==llb) b2[i]=Low[llb]-SignalGap*Point;

      if (i==hhb2) b3[i]=High[hhb2]+SignalGap*Point;
      if (i==llb2) b4[i]=Low[llb2]-SignalGap*Point;
     }

}
Comments