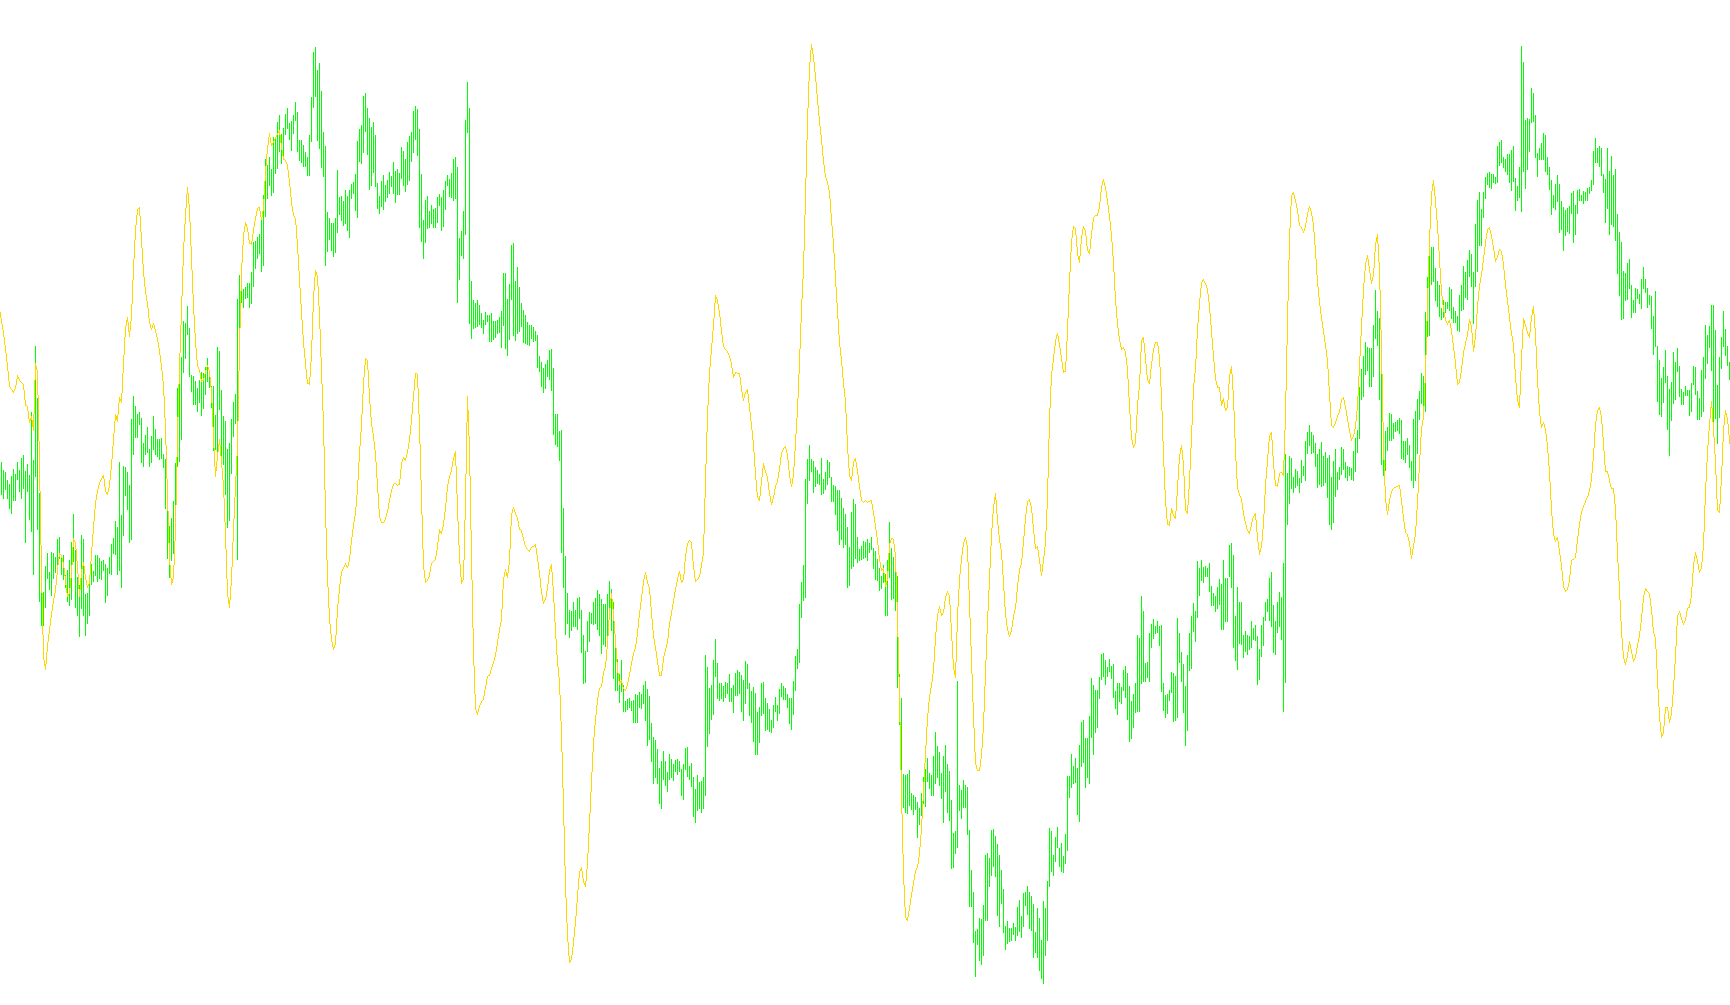
This technical tool is designed to provide traders with a visual representation of market momentum and trend direction by combining three distinct types of financial data. Instead of looking at price movements in isolation, the script calculates the relationship between short-term speed, long-term trends, and market volatility.
How the Logic Works
The indicator functions by processing three primary components of market behavior:
- Short-Term vs. Long-Term Speed: The logic first identifies two different moving averages—one that reacts quickly to recent price changes and another that tracks the broader, slower trend. By measuring the gap between these two, the tool determines the current "velocity" of the market.
- Volatility Integration: To ensure the data isContextually accurate, the script incorporates a volatility measurement. This helps the tool understand whether a price move is a significant shift or just minor "noise," allowing the calculation to remain relevant during different market conditions.
- Mathematical Smoothing (The Fisher Transformation): The core of the script uses a specific mathematical formula to convert these raw values into a smoothed line. This transformation is designed to reduce the "choppiness" often found in standard indicators, making it easier for a trader to see clear shifts in momentum without being distracted by constant minor fluctuations.
What This Means for the User
The final result is displayed as a smooth line in a separate window on your trading platform. Rather than showing you the price of an asset, it shows you the strength and direction of the trend.
When the line moves upward, it indicates that the short-term momentum is pulling away from the long-term average with significant strength; when it moves downward, it suggests a loss of energy or a reversal in trend. By filtering out market noise through these combined calculations, the tool aims to provide a clearer picture of where the market's "pulse" is heading.
/*-----------------------------+
|			       |
| Shared by www.Aptrafx.com    |
|			       |
+------------------------------*/

//+------------------------------------------------------------------+
//|                                               RAVI FX Fisher.mq4 |
//|                         Copyright © 2005, Luis Guilherme Damiani |
//|                                      http://www.damianifx.com.br |
//+------------------------------------------------------------------+
#property copyright "Copyright © 2005, Luis Guilherme Damiani"
#property link      "http://www.damianifx.com.br"

#property indicator_separate_window
#property indicator_buffers 1
#property indicator_color1 MediumSeaGreen

extern int       MAfast=4;
extern int       MAslow=49;

double RAVIfxFishBuffer[];


int init()
  {
   SetIndexStyle(0,DRAW_LINE);
   SetIndexBuffer(0,RAVIfxFishBuffer);
   return(0);
  }


int deinit()
  {
   return(0);
  }


int start()
  {
      double MAValue=0;
      double IFish=0;

      double imaFast=0;
      double imaSlow=0;
      double iATRFast=0;

      for (int shift = 0; shift<=Bars-100;shift++)
      {
	     imaFast=iMA(NULL,0,MAfast,0,MODE_LWMA,PRICE_TYPICAL,shift);
	     imaSlow=iMA(NULL,0,MAslow,0,MODE_LWMA,PRICE_TYPICAL,shift);
	     iATRFast=iATR(NULL,0,MAfast,shift);

	     MAValue = 100 * (imaFast - imaSlow)* iATRFast/imaSlow/iATRFast;
	     IFish=(MathExp(2*MAValue)-1)/(MathExp(2*MAValue)+1);

         RAVIfxFishBuffer[shift]=IFish;
       }

   return(0);
  }
Comments