Regression_Channel
Download script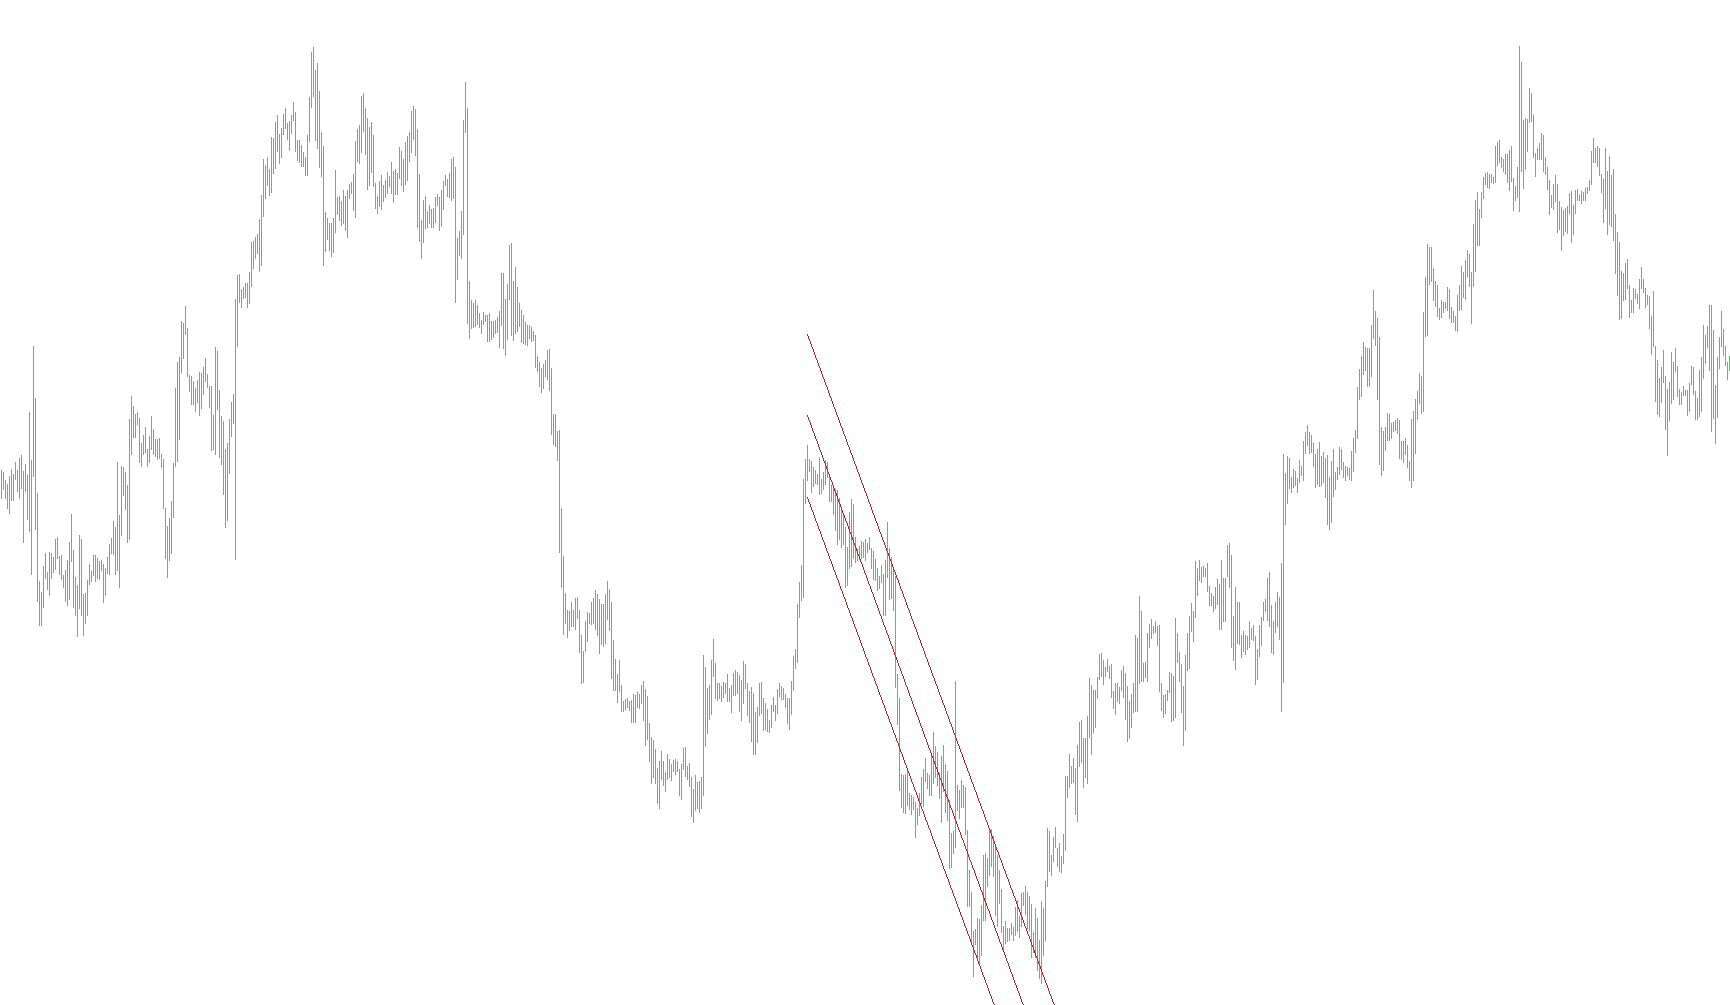
This script is a technical analysis tool designed to automatically identify and draw a "Regression Channel" on a trading chart. In simple terms, it acts as a visual guide that helps traders understand the primary trend of a currency or asset by drawing a corridor that encompasses price movement over a specific period.
Core Logic Overview
The tool operates by finding significant historical price boundaries and then calculating a mathematical "best fit" line to connect them. Instead of simply connecting two random points, it uses a statistical method to ensure the channel accurately represents the trend's trajectory.
Step-by-Step Process
1. Identifying the Trend Boundaries The script begins by scanning historical price data to find two pivotal moments:
- It looks for a significant "low" point where the price dropped below a specific moving average threshold.
- It looks for a significant "high" point where the price broke above a similar threshold. By identifying these two extremes, the script establishes the starting and ending points of the trend it wants to measure.
2. Calculating the Trend Line (The Middle Path) Once the start and end points are established, the script performs a mathematical calculation to determine the "middle" of the channel. It uses a linear regression formula, which essentially calculates the most accurate straight line that minimizes the distance between all the individual price points within that timeframe. This creates the central spine of the channel.
3. Defining the Channel Width (The Boundaries) To create the top and bottom edges of the channel (the "walls"), the script looks at how much the price typically deviates from the middle path.
- It calculates the standard deviation—a measure of volatility—to see how far prices usually stray from the center.
- It then applies a multiplier (set by the user, such as the Fibonacci number 1.618) to determine how wide the boundaries should be. This ensures that the channel is wide enough to contain most price action while remaining tight enough to be useful for analysis.
4. Visual Output Finally, the script draws three distinct lines on your chart:
- The Middle Line: The core trend path.
- The Upper Boundary: The ceiling of the trend.
- The Lower Boundary: The floor of the trend.
Practical Purpose
For a non-programmer, this tool automates the tedious task of drawing trend lines manually. By providing a statistically derived channel, it helps traders visualize whether the price is currently "overextended" (hitting the ceiling or floor) or following the established path of least resistance.
/*-----------------------------+
|			       |
| Shared by www.Aptrafx.com    |
|			       |
+------------------------------*/

//+------------------------------------------------------------------+
//|                                           Regression_Channel.mq4 |
//|                                        Converted to MT4 by KimIV |
//+------------------------------------------------------------------+
/*[[
	Name := Regression_Channel
	Author := Copyright © 2004, MetaQuotes Software Corp.
	Link := http://www.metaquotes.net/
]]*/
#property copyright "KimIV"
#property link      "http://www.kimiv.ru"

#property indicator_chart_window

//------- Âíåøíèå ïàðàìåòðû èíäèêàòîðà -------------------------------
extern int    NumberName   = 1;
extern int    iPeriod      = 56;
extern double MAShoot      = 50;
extern int    LineWeight   = 1;
extern double StDev = 1.618;
extern color LineColor = Brown;


//+------------------------------------------------------------------+
//| Custom indicator initialization function                         |
//+------------------------------------------------------------------+
void init() {
  ObjectCreate("Regression_middle"+NumberName, OBJ_TREND, 0, 0,0, 0,0);
	ObjectSet("Regression_middle"+NumberName, OBJPROP_COLOR, LineColor);
 	ObjectSet("Regression_middle"+NumberName, OBJPROP_STYLE, STYLE_SOLID);
 	ObjectSet("Regression_middle"+NumberName, OBJPROP_WIDTH, LineWeight);
  ObjectCreate("Regression_upper" +NumberName, OBJ_TREND, 0, 0,0, 0,0);
 	ObjectSet("Regression_upper"+NumberName, OBJPROP_STYLE, STYLE_SOLID);
 	ObjectSet("Regression_upper"+NumberName, OBJPROP_WIDTH, LineWeight);
  ObjectCreate("Regression_lower" +NumberName, OBJ_TREND, 0, 0,0, 0,0);
 	ObjectSet("Regression_lower"+NumberName, OBJPROP_STYLE, STYLE_SOLID);
 	ObjectSet("Regression_lower"+NumberName, OBJPROP_WIDTH, LineWeight);

  Comment("Auto Regression channel");
}

//+------------------------------------------------------------------+
//| Custor indicator deinitialization function                       |
//+------------------------------------------------------------------+
void deinit() {
  ObjectDelete("Regression_middle"+NumberName);
  ObjectDelete("Regression_upper" +NumberName);
  ObjectDelete("Regression_lower" +NumberName);
  Comment("");
}

//+------------------------------------------------------------------+
//| Custom indicator iteration function                              |
//+------------------------------------------------------------------+
void start() {
  bool   check_low, check_high;
  bool   check_upper_chanel;
  double save_low, save_high;
  double MA, a1, a2, a3, b1, a_, b_, y1, y2, price;
  double stddiv_low, stddiv_high, tmp_div;
  double x_n_up, x_1_up, x_n_down, x_1_down;
  double ratio_currency;
  int     shift;
  int    n, n_begin, n_end;
  int    MAType, MAPrice;
  int    save_shift_low, save_shift_high;

  save_low = -1;
  save_high = -1;
  save_shift_low = -1;
  save_shift_high = -1;

  check_low = false;
  check_high = false;

  MAType = MODE_SMA;
  MAPrice = PRICE_CLOSE;

  if (Close[1]>80) ratio_currency = 100;
  else ratio_currency = 10000;

  // Ïîèñê òî÷åê ïåðåñå÷åíèÿ ñ ÌÀ
  for (shift=Bars-1; shift>=0; shift--) {
  	MA = iMA(NULL, 0, iPeriod, 0, MAType, MAPrice, shift);
  	if (MA-MAShoot/ratio_currency>Close[shift])	{
  		if (Close[shift]<save_low || save_low==-1) {
  			check_low = true;
  			save_low = Close[shift];
  			save_shift_low = shift;
  		}
  	}

  	if (MA+MAShoot/ratio_currency<Close[shift]) {
  		if (save_high<Close[shift] || save_high==-1) {
  			check_high = true;
  			save_high = Close[shift];
  			save_shift_high = shift;
  		}
  	}

  	if (check_low) {
  		if (MA+MAShoot/ratio_currency<Close[shift])	{
  			check_low = false;
  			save_low = -1;
  		}
  	}

  	if (check_high) {
  		if (MA-MAShoot/ratio_currency>Close[shift]) {
  			check_high = false;
  			save_high = -1;
  		}
  	}
  }

  //Îïðåäåëåíèå ãðàíèö ïîñòðîåíèÿ êàíàëëà
  if (save_shift_low>save_shift_high) {
  	n_begin = save_shift_low;
  	n_end = save_shift_high;
  } else {
  	n_begin = save_shift_high;
  	n_end = save_shift_low;
  }

  if (n_end==0) n_end = 1; // Íóëåâîé áàð íå èñïîëüçîâàòü
  n = n_begin - n_end + 1; // äëèíà êàíàëà

  a1 = 0;
  a2 = 0;
  a3 = 0;
  b1 = 0;
  a_ = 0;
  b_ = 0;
  y1 = 0;
  y2 = 0;
  tmp_div = 0;

  if (Close[n_begin]<Close[n_end]) check_upper_chanel = true;
  else check_upper_chanel = false;

  for (shift=n_begin; shift>=n_end; shift--) {
  	if (check_upper_chanel) price = Low[shift];
  	else price = High[shift];

  	a1 = a1 + shift*price;
  	a2 = a2 + shift;
  	a3 = a3 + price;
  	b1 = b1 + shift*shift;
  }

  b_ = (n*a1 - a2*a3)/(n*b1 - a2*a2);
  a_ = (a3 - b_*a2)/n;
  y1 = a_ + b_*n_begin;
  y2 = a_ + b_*n_end;

 	ObjectSet("Regression_middle"+NumberName, OBJPROP_TIME1, Time[n_begin]);
 	ObjectSet("Regression_middle"+NumberName, OBJPROP_TIME2, Time[n_end]);
 	ObjectSet("Regression_middle"+NumberName, OBJPROP_PRICE1, y1);
 	ObjectSet("Regression_middle"+NumberName, OBJPROP_PRICE2, y2);

  for (shift=n_begin; shift>=n_end; shift--) {
  	if (check_upper_chanel) price = Low[shift];
	  else price = High[shift];

  	tmp_div = tmp_div + (price - (a_ + b_*shift))*(price - (a_ + b_*shift));
  }

  stddiv_low = MathSqrt(tmp_div/n);
  stddiv_high = MathSqrt(tmp_div/n);

  x_n_up = y1 + StDev*stddiv_high;
  x_1_up = y2 + StDev*stddiv_high;

  x_n_down = y1 - StDev*stddiv_low;
  x_1_down = y2 - StDev*stddiv_low;


  //upper
 	ObjectSet("Regression_upper"+NumberName, OBJPROP_TIME1, Time[n_begin]);
 	ObjectSet("Regression_upper"+NumberName, OBJPROP_TIME2, Time[n_end]);
 	ObjectSet("Regression_upper"+NumberName, OBJPROP_PRICE1, x_n_up);
 	ObjectSet("Regression_upper"+NumberName, OBJPROP_PRICE2, x_1_up);
	ObjectSet("Regression_upper"+NumberName, OBJPROP_COLOR, LineColor);
  //lower
 	ObjectSet("Regression_lower"+NumberName, OBJPROP_TIME1, Time[n_begin]);
 	ObjectSet("Regression_lower"+NumberName, OBJPROP_TIME2, Time[n_end]);
 	ObjectSet("Regression_lower"+NumberName, OBJPROP_PRICE1, x_n_down);
 	ObjectSet("Regression_lower"+NumberName, OBJPROP_PRICE2, x_1_down);
 	ObjectSet("Regression_lower"+NumberName, OBJPROP_COLOR, LineColor);


}
//-------------------------------------------------------------------+
Comments