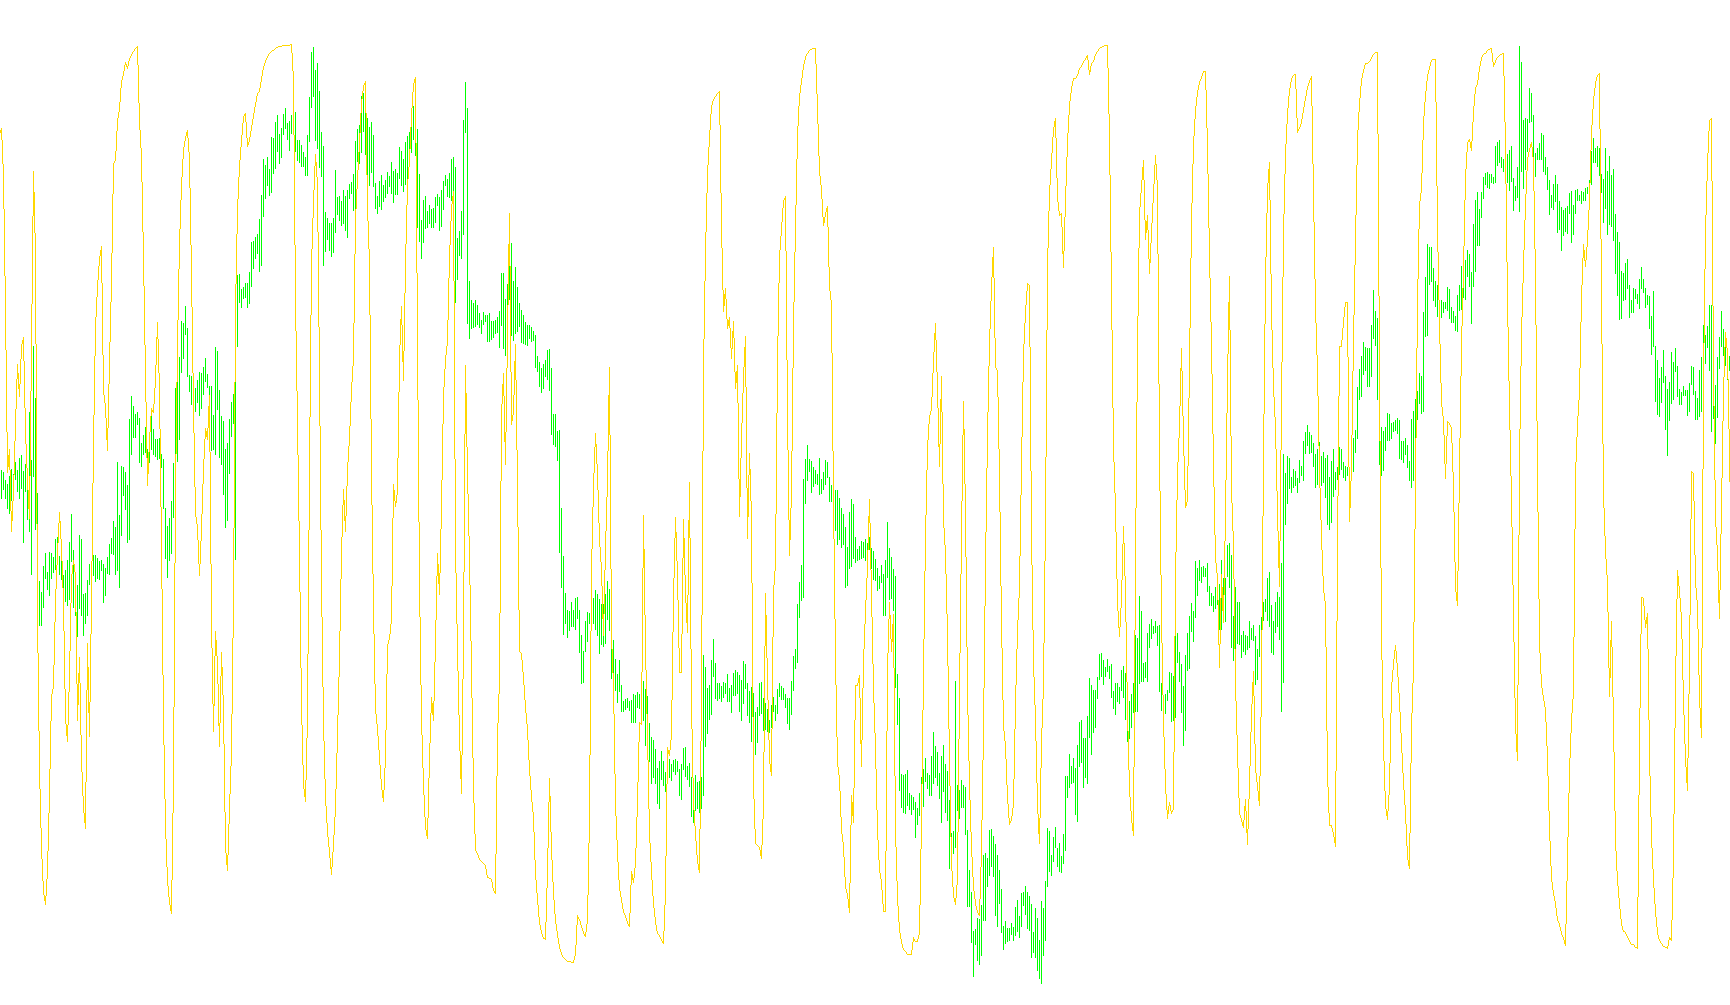
This script functions as a technical analysis tool designed to measure and visualize "Relative Momentum." Instead of simply looking at whether a price is going up or down, this indicator focuses on the intensity and balance between upward and downward movements over a specific period of time.
Core Logic Overview
The primary goal of this tool is to determine the dominance of positive momentum versus negative momentum. It achieves this by calculating the difference between current prices and previous prices (based on a user-defined "Shift" and "Period") and then categorizing those differences into two separate buckets: positive gains and negative losses.
How it Works Step-by-Step
- Data Collection: The script looks back at a set number of past candles (the Period). For each candle in that window, it compares the closing price to a slightly older price.
- Separation of Movements:
- If the price moved up, that specific amount of growth is added to a "Positive" total.
- If the price moved down, the magnitude of that drop is added to a "Negative" total.
- Moving Average Smoothing: To ensure the data isn't too erratic or jumpy, the script uses a moving average calculation. It blends the current momentum values with the previous results. This creates a smoother line that reflects consistent trends rather than momentary price spikes.
- The Final Calculation: The script then takes these two totals—the sum of all positive moves and the sum of all negative moves—and converts them into a percentage.
- It calculates what portion of the total "action" was upward versus downward.
- This result is expressed as a value out of 100, plotted on a separate window at the bottom of your trading chart.
Practical Interpretation
The indicator provides a visual representation of market sentiment:
- High Values: Indicate that positive momentum is significantly stronger than negative momentum.
- Low Values: Indicate that negative momentum is dominating the price action.
- Mid-Range Values: Suggest a state of equilibrium where upward and downward pressures are relatively balanced.
By observing the speed and direction of the resulting line, traders can better understand the underlying strength of a trend without being distracted by minor "noise" in the price fluctuations.
//+------------------------------------------------------------------+
//|                                                          RMI.mq4 |
//|                                 Copyright © 2006, DaVinciProject |
//|                                        http://www.metaquotes.net |
//+------------------------------------------------------------------+
#property copyright "Copyright © 2006, DaVinciProject"
#property link      "http://www.metaquotes.net"

#property indicator_separate_window
#property indicator_buffers 1
#property indicator_color1 DodgerBlue
#property indicator_level1 15
#property indicator_level2 85
//---- input parameters
extern int RMIPeriod=5;
extern int Shift=5;
//---- buffers
double RMIBuffer[];
double PosBuffer[];
double NegBuffer[];
//+------------------------------------------------------------------+
//| Custom indicator initialization function                         |
//+------------------------------------------------------------------+
int init()
  {
//---- indicators
   string short_name;
//---- 2 additional buffers are used for counting.
   IndicatorBuffers(3);
   SetIndexBuffer(1,PosBuffer);
   SetIndexBuffer(2,NegBuffer);
//---- indicator line
   SetIndexStyle(0,DRAW_LINE);
   SetIndexBuffer(0,RMIBuffer);
//---- name for DataWindow and indicator subwindow label
   short_name="RMI("+RMIPeriod+")";
   IndicatorShortName(short_name);
   SetIndexLabel(0,short_name);
//----
   SetIndexDrawBegin(0,RMIPeriod);
//----
   return(0);
  }
//+------------------------------------------------------------------+
//| Custom indicator deinitialization function                       |
//+------------------------------------------------------------------+
int deinit()
  {
//----

//----
   return(0);
  }
//+------------------------------------------------------------------+
//| RMI - Relative Momentum Index                                    |
//+------------------------------------------------------------------+
int start()
  {
   int    i,counted_bars=IndicatorCounted();
   double rel,negative,positive;
//----
   if(Bars<=RMIPeriod) return(0);
//---- initial zero
   if(counted_bars<1)
      for(i=1;i<=RMIPeriod;i++) RMIBuffer[Bars-i]=0.0;
//----
   i=Bars-RMIPeriod-1;
   if(counted_bars>=RMIPeriod) i=Bars-counted_bars-1;
   while(i>=0)
     {
      double sumn=0.0,sump=0.0;
      if(i==Bars-RMIPeriod-1)
        {
         int k=Bars-2;
         //---- initial accumulation
         while(k>=i)
           {
            rel=Close[k]-Close[k+Shift];
            if(rel>0) sump+=rel;
            else      sumn-=rel;
            k--;
           }
         positive=sump/RMIPeriod;
         negative=sumn/RMIPeriod;
        }
      else
        {
         //---- simple moving average
         rel=Close[i]-Close[i+Shift];
         if(rel>0) sump=rel;
         else      sumn=-rel;
         positive=(PosBuffer[i+1]*(RMIPeriod-1)+sump)/RMIPeriod;
         negative=(NegBuffer[i+1]*(RMIPeriod-1)+sumn)/RMIPeriod;
        }
      PosBuffer[i]=positive;
      NegBuffer[i]=negative;
      if(negative==0.0) RMIBuffer[i]=0.0;
      else RMIBuffer[i]=100.0*positive/(positive+negative);
      i--;
}
//----
   return(0);
  }
//+------------------------------------------------------------------+
Comments