RSI_MA
Download script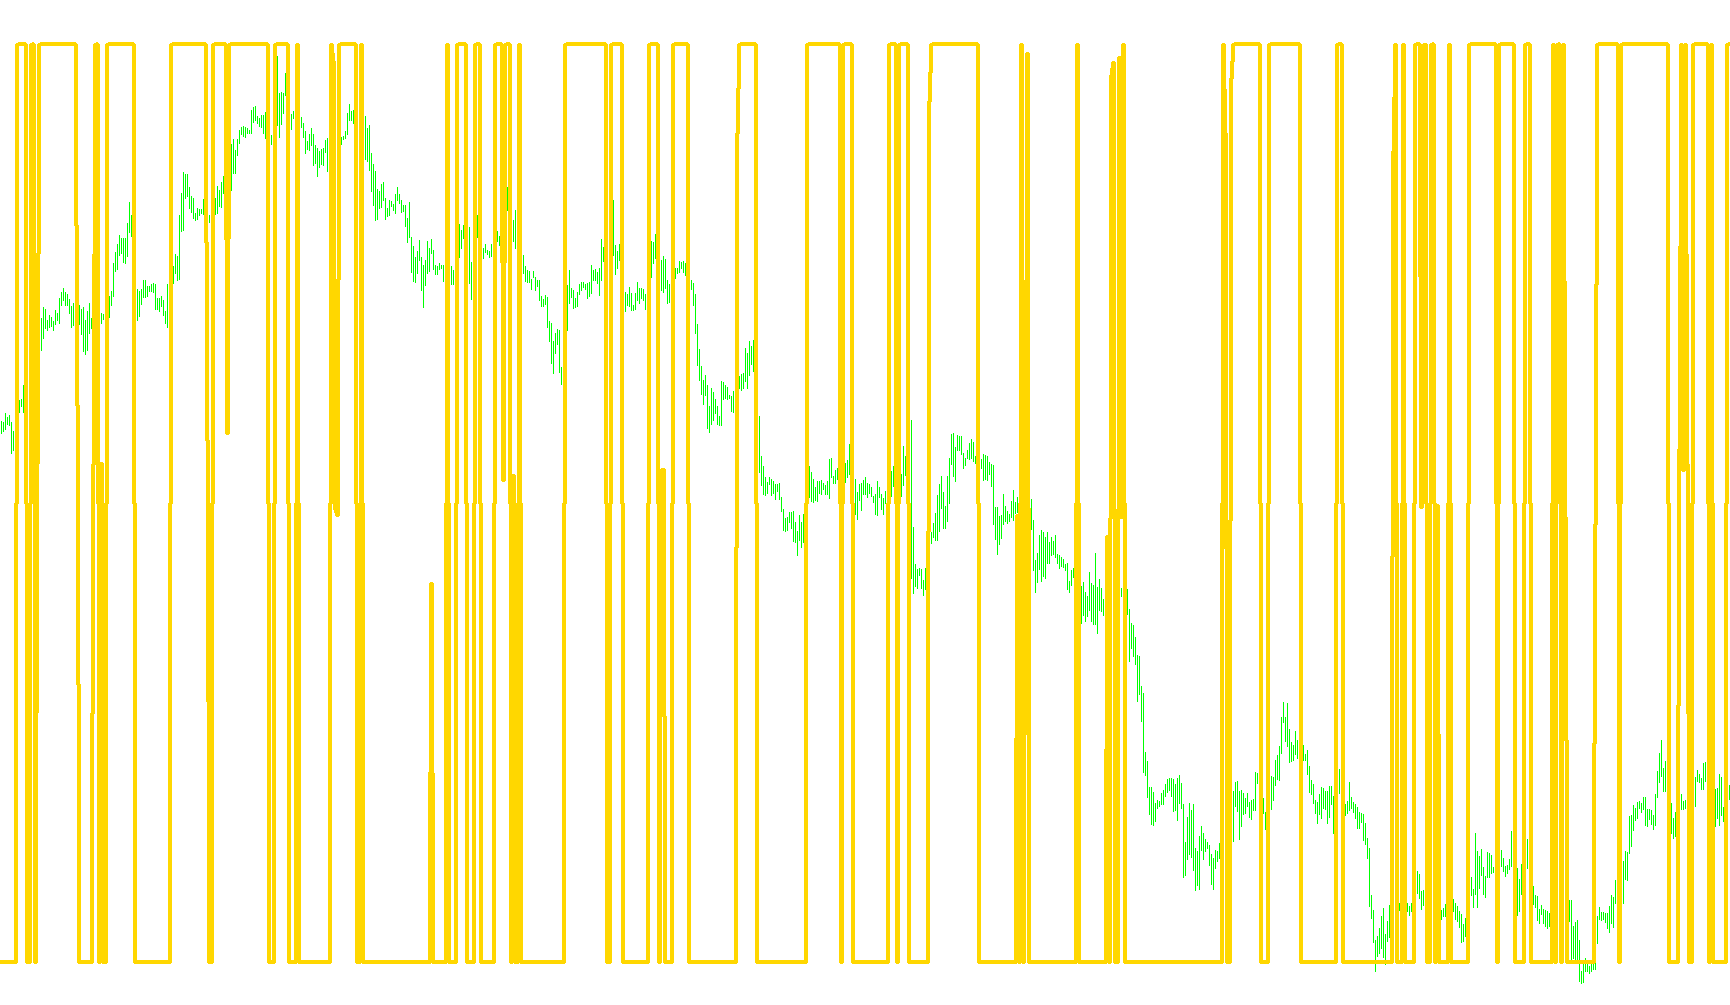
This technical tool is designed to provide traders with a specialized visualization of market momentum by combining two well-known financial concepts: the Relative Strength Index (RSI) and a Moving Average (MA). Instead of showing you raw price data, this indicator focuses on the "strength" of price movements to help identify trends and potential overbought or oversold conditions.
How it Works
1. Measuring Momentum (The RSI Component) At its core, the script calculates the momentum of an asset by looking at the difference between consecutive closing prices over a specific period (defaulting to 14 bars). It separates these movements into "positive" gains and "negative" losses. By smoothing these values out, it creates a Relative Strength Index, which helps determine if an asset is moving up or down with significant force.
2. The Smoothing Process Rather than calculating every data point from scratch—which can lead to "choppy" or jagged lines—the script uses a smoothed moving average approach. It takes the previous known values and blends them with new data. This ensures that the resulting line is more fluid and less reactive to minor, insignificant price flickers, providing a clearer picture of the underlying trend.
3. The Weighted Calculation (The MA Component) A unique feature of this script is how it finalizes the output. It takes the momentum data and applies a "Weighted Moving Average" calculation. This means that more recent price actions are given slightly more importance than older data points. By calculating the difference between these weighted averages, the script creates a dynamic multiplier.
4. The Final Output The final line you see on your chart is a product of both the momentum strength and this weighted change. The script then performs a "sanity check" to ensure the values remain within a logical scale:
- If the calculated value exceeds 100, it is capped at 100.
- If the calculated value falls below 0, it is capped at 0.
What this means for you
By combining these methods, the indicator aims to provide a refined view of market velocity. It helps filter out "noise" that might appear in a standard RSI while still highlighting significant shifts in price power. The red line on your chart represents this refined momentum, helping you stay aligned with the prevailing trend of the market.
/*------------------------------------------------------------------+
 |                                                       RSI_MA.mq4 |
 |                                                 Copyright © 2010 |
 +------------------------------------------------------------------*/
#property link      "basisforex@gmail.com"
//-----
#property indicator_separate_window
#property indicator_minimum 0
#property indicator_maximum 100
#property indicator_buffers 1
#property indicator_color1 Red
#property indicator_level1 20
#property indicator_level2 80
#property indicator_levelcolor White
//---- input parameters
extern int RSIPeriod=14;
//---- buffers
double RSIBuffer[];
double PosBuffer[];
double NegBuffer[];
double RSIBuf[];
//+------------------------------------------------------------------+
//| Custom indicator initialization function                         |
//+------------------------------------------------------------------+
int init()
  {
   string short_name;
//---- 2 additional buffers are used for counting.
   IndicatorBuffers(4);
   SetIndexBuffer(1,PosBuffer);
   SetIndexBuffer(2,NegBuffer);
   SetIndexBuffer(3,RSIBuf);
//---- indicator line
   SetIndexStyle(0,DRAW_LINE, STYLE_SOLID, 4);
   SetIndexBuffer(0,RSIBuffer);
//---- name for DataWindow and indicator subwindow label
   short_name="RSI-MA("+RSIPeriod+")";
   IndicatorShortName(short_name);
   SetIndexLabel(0,short_name);
//----
   SetIndexDrawBegin(0,RSIPeriod);
//----
   return(0);
  }
//+------------------------------------------------------------------+
//| Relative Strength Index                                          |
//+------------------------------------------------------------------+
int start()
  {
   int    i,counted_bars=IndicatorCounted();
   double rel,negative,positive;
   int maDif;
//----
   if(Bars<=RSIPeriod) return(0);
//---- initial zero
   if(counted_bars<1)
      for(i=1;i<=RSIPeriod;i++) RSIBuffer[Bars-i]=0.0;
//----
   i=Bars-RSIPeriod-1;
   if(counted_bars>=RSIPeriod) i=Bars-counted_bars-1;
   while(i>=0)
     {
      double sumn=0.0,sump=0.0;
      if(i==Bars-RSIPeriod-1)
        {
         int k=Bars-2;
         //---- initial accumulation
         while(k>=i)
           {
            rel=Close[k]-Close[k+1];
            if(rel>0) sump+=rel;
            else      sumn-=rel;
            k--;
           }
         positive=sump/RSIPeriod;
         negative=sumn/RSIPeriod;
        }
      else
        {
         //---- smoothed moving average
         rel=Close[i]-Close[i+1];
         if(rel>0) sump=rel;
         else      sumn=-rel;
         positive=(PosBuffer[i+1]*(RSIPeriod-1)+sump)/RSIPeriod;
         negative=(NegBuffer[i+1]*(RSIPeriod-1)+sumn)/RSIPeriod;
        }
      PosBuffer[i]=positive;
      NegBuffer[i]=negative;
      if(negative==0.0) RSIBuf[i]=0.0;
      else RSIBuf[i]=100.0-100.0/(1+positive/negative);
      maDif = (iMA(NULL, 0, RSIPeriod, 0, MODE_EMA, PRICE_WEIGHTED, i) - iMA(NULL, 0, RSIPeriod, 0, MODE_EMA, PRICE_WEIGHTED, i + 1)) / Point;
      RSIBuffer[i] = RSIBuf[i] * maDif;
      if(RSIBuffer[i] > 100) RSIBuffer[i] = 100;
      if(RSIBuffer[i] < 0) RSIBuffer[i] = 0;
      i--;
     }
//----
   return(0);
  }
//+------------------------------------------------------------------+
Comments