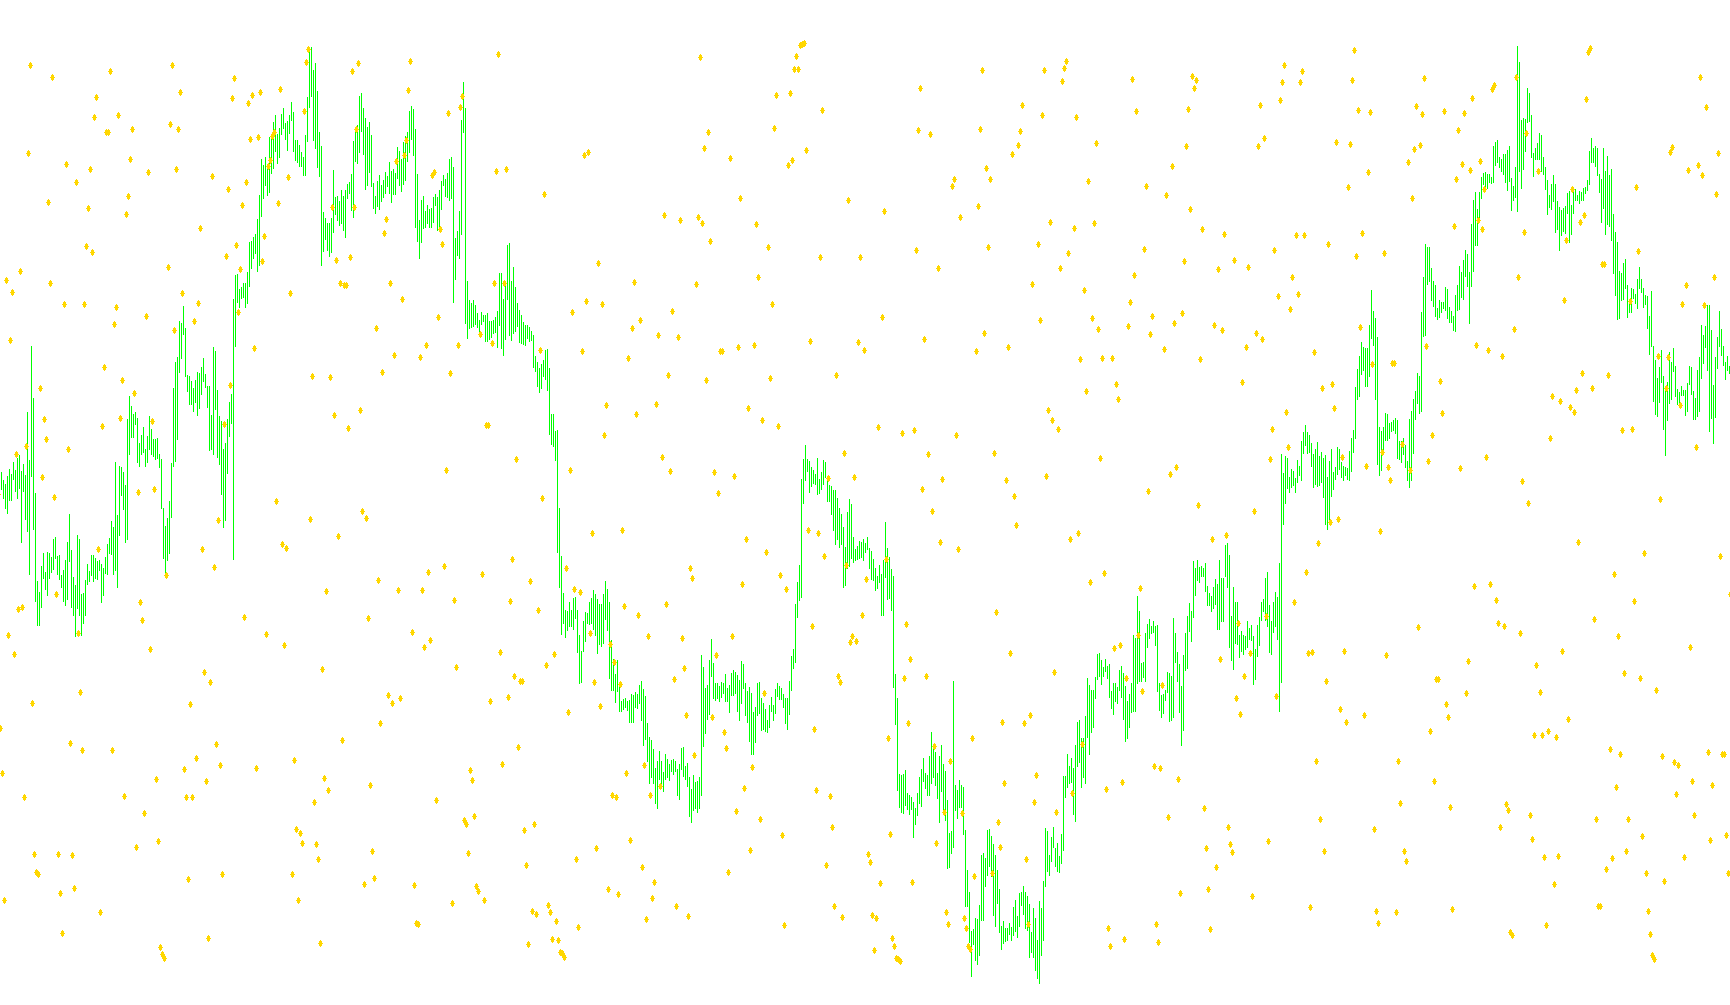
This tool is designed to provide a visual representation of market momentum by calculating the Relative Strength Index (RSI), a common technical indicator used to determine whether an asset is being overbought or oversold.
Instead of showing a simple fluctuating line, this script identifies specific data points and translates them into a visual format that helps traders understand the strength of price movements over a set period. Here is a breakdown of how the logic functions:
Core Mechanics
The tool operates by analyzing the relationship between recent price increases and decreases. It specifically looks at the "closing prices" of candles to determine the direction of the market.
- Momentum Tracking: The script calculates the difference between consecutive closing prices. If the price moves up, it tracks the amount of that gain; if it moves down, it tracks the magnitude of that loss.
- Smoothing Process: Rather than reacting wildly to every single price tick, the logic uses a "smoothed" approach. It takes the average gains and losses over a specific timeframe (defined by the user as the RSIPeriod). This ensures that the resulting data is less "noisy" and more reflective of a sustained trend.
How the Calculation Works
The script processes the data in two distinct phases:
- Initial Baseline: When the tool first starts reading the chart, it performs an initial sum of all gains and losses within the first period to establish a starting point for the calculation.
- Continuous Update: As new price data arrives, the tool uses the previous results to calculate the new average. It balances the current move against the historical "momentum" captured in the previous bars, allowing for a fluid transition of data across the chart.
Visual Output and Interpretation
The final result is a value mapped on a scale of 0 to 100, displayed in a separate window below your main price chart.
- Strength Calculation: The logic converts the ratio of gains to losses into a percentage-style figure.
- Reference Levels: The tool includes predefined horizontal levels (such as 75, 65, 35, and 25) to help you identify extreme market conditions. When the calculated value reaches these high or low thresholds, it indicates that the market may be stretched too far in one direction, potentially signaling a reversal or a period of cooling off.
In summary, this script automates the complex math required to weigh recent price gains against losses, providing you with a clear, smoothed perspective on whether the current market trend has significant strength or is reaching an exhausted state.
//+------------------------------------------------------------------+
//|    Dots added by Accrete : )  accrete.com            RSIdots.mq4 |
//|                      Copyright © 2004, MetaQuotes Software Corp. |
//|                                       http://www.metaquotes.net/ |
//+------------------------------------------------------------------+
#property copyright "Copyright © 2004, MetaQuotes Software Corp."
#property link      "http://www.metaquotes.net/"
//----
#property indicator_separate_window
#property indicator_minimum 0
#property indicator_maximum 100
#property indicator_buffers 1
#property indicator_color1 Yellow
#property indicator_level1 75
#property indicator_level2 25
#property indicator_level3 65
#property indicator_level4 35
//---- input parameters
extern int RSIPeriod=2;
//---- buffers
double RSIBuffer[];
double PosBuffer[];
double NegBuffer[];
//+------------------------------------------------------------------+
//| Custom indicator initialization function                         |
//+------------------------------------------------------------------+
int init()
  {
   string short_name;
//---- 2 additional buffers are used for counting.
   IndicatorBuffers(3);
   SetIndexBuffer(1,PosBuffer);
   SetIndexBuffer(2,NegBuffer);
//---- indicator line
   SetIndexStyle(0,DRAW_ARROW,EMPTY);
   SetIndexArrow(0,115);
   SetIndexBuffer(0,RSIBuffer);
//---- name for DataWindow and indicator subwindow label
   short_name="RSI("+RSIPeriod+")";
   IndicatorShortName(short_name);
   SetIndexLabel(0,short_name);
//----
   SetIndexDrawBegin(0,RSIPeriod);
//----
   return(0);
  }
//+------------------------------------------------------------------+
//| Relative Strength Index                                          |
//+------------------------------------------------------------------+
int start()
  {
   int    i,counted_bars=IndicatorCounted();
   double rel,negative,positive;
//----
   if(Bars<=RSIPeriod) return(0);
//---- initial zero
   if(counted_bars<1)
      for(i=1;i<=RSIPeriod;i++) RSIBuffer[Bars-i]=0.0;
//----
   i=Bars-RSIPeriod-1;
   if(counted_bars>=RSIPeriod) i=Bars-counted_bars-1;
   while(i>=0)
     {
      double sumn=0.0,sump=0.0;
      if(i==Bars-RSIPeriod-1)
        {
         int k=Bars-2;
         //---- initial accumulation
         while(k>=i)
           {
            rel=Close[k]-Close[k+1];
            if(rel>0) sump+=rel;
            else      sumn-=rel;
            k--;
           }
         positive=sump/RSIPeriod;
         negative=sumn/RSIPeriod;
        }
      else
        {
         //---- smoothed moving average
         rel=Close[i]-Close[i+1];
         if(rel>0) sump=rel;
         else      sumn=-rel;
         positive=(PosBuffer[i+1]*(RSIPeriod-1)+sump)/RSIPeriod;
         negative=(NegBuffer[i+1]*(RSIPeriod-1)+sumn)/RSIPeriod;
        }
      PosBuffer[i]=positive;
      NegBuffer[i]=negative;
      if(negative==0.0) RSIBuffer[i]=0.0;
      else RSIBuffer[i]=100.0-100.0/(1+positive/negative);
      i--;
     }
//----
   return(0);
  }
//+------------------------------------------------------------------+
Comments