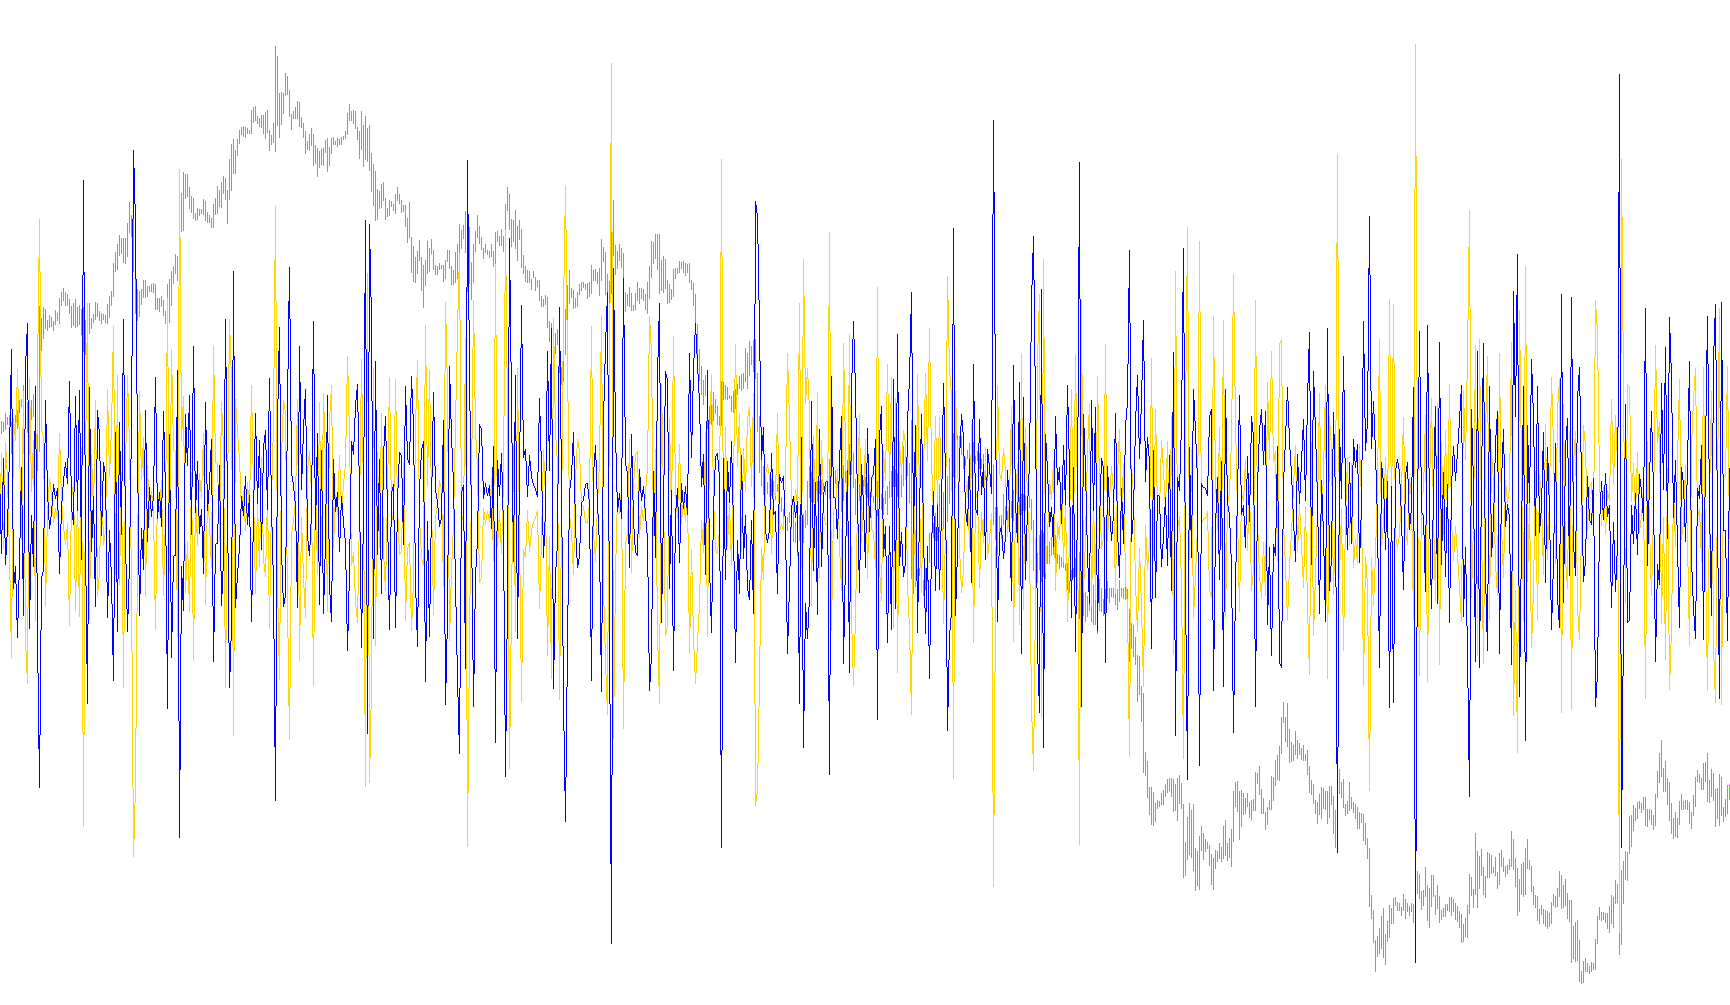
This tool is designed to provide traders with a specialized visual representation of price momentum by analyzing the relationship between different types of market data. Instead of showing a standard Relative Strength Index (RSI) on its own, this script calculates and displays two distinct "mirrored" variations of the index simultaneously.
How the Logic Works
The core functionality revolves around measuring the gap between two specific price points: the Closing Price and the Opening Price of each candle. The script processes these points in two different directions to create a unique visual output:
- The First Signal (Red Line): This calculates the momentum based on how much the closing price has moved away from the opening price. It essentially shows the strength of the move that occurred during the trading session.
- The Second Signal (Blue Line): This performs the inverse calculation, measuring the difference by subtracting the closing movement from the opening movement.
What This Means for the User
By plotting these two calculations side-by-side in a separate window, the script allows you to visualize the "mirror" effect of price action. Rather than just seeing if the market is overbought or oversold (as a standard RSI would), this tool highlights the divergence between how a candle started and how it finished.
When these two lines move in relation to one another, they provide a clearer picture of the underlying pressure behind price movements. It helps traders identify nuances in price velocity by showing both sides of the opening-to-closing price dynamic in a single, easy-to-read visual format.
//+------------------------------------------------------------------+
//|                                                   RSI_Mirror.mq4 |
//|                                   Copyright © 2010, Andy Tjatur. |
//|                                            andy.tjatur@gmail.com |
//+------------------------------------------------------------------+
#property  copyright "Copyright © 2010, Andy Tjatur."
#property  link      "andy.tjatur@gmail.com"
//---- indicator settings
#property  indicator_separate_window
#property indicator_level1 1
#property indicator_levelcolor White
#property  indicator_buffers 2
#property  indicator_color1  Red
#property  indicator_color2  Blue
#property  indicator_width1 2
#property  indicator_width2 2

extern double RSI_Period       = 20;

double     RsiBuffer1[];
double     RsiBuffer2[];


//+------------------------------------------------------------------+
//| Custom indicator initialization function                         |
//+------------------------------------------------------------------+
int init()
  {
//---- drawing settings
   SetIndexStyle(0,DRAW_LINE);
   SetIndexStyle(1,DRAW_LINE);


   IndicatorDigits(Digits+1);
//---- indicator buffers mapping
   SetIndexBuffer(0,RsiBuffer1);
   SetIndexBuffer(1,RsiBuffer2);


   IndicatorShortName("RSI_Mirror by Andy Tjatur");
   SetIndexLabel(0,"RSI_Close");
   SetIndexLabel(1,"RSI_Open");


   return(0);
  }
//+------------------------------------------------------------------+
//| RSI Mirror                                           |
//+------------------------------------------------------------------+
int start()
  {
   int limit;
   int counted_bars=IndicatorCounted();

   if(counted_bars>0) counted_bars--;
   limit=Bars-counted_bars;


   for(int i=0; i<limit; i++)
      RsiBuffer1[i]=iRSI(NULL, 0, RSI_Period, PRICE_CLOSE, i)- iRSI(NULL, 0, RSI_Period, PRICE_OPEN, i);


   for(i=0; i<limit; i++)
      RsiBuffer2[i]=iRSI(NULL, 0, RSI_Period, PRICE_OPEN, i)- iRSI(NULL, 0, RSI_Period, PRICE_CLOSE, i);


   return(0);
  }
//+------------------------------------------------------------------+
Comments