RSX_005
Download script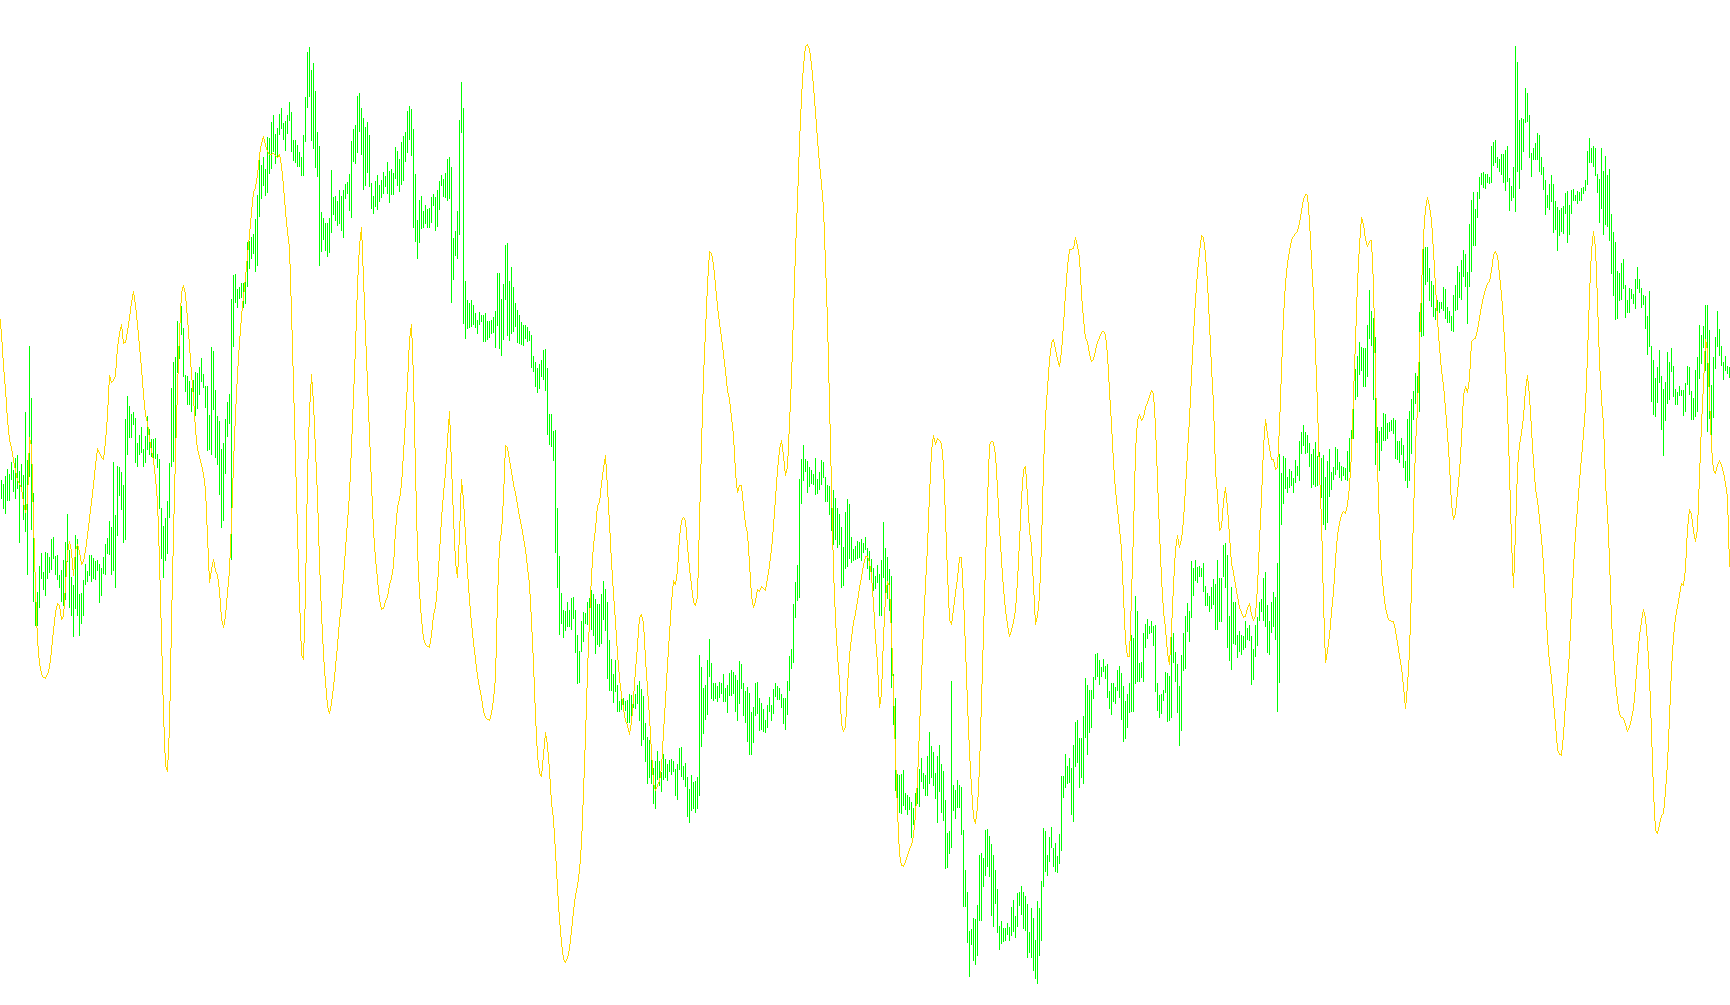
This indicator is designed to provide traders with a visual representation of market momentum and price action intensity. Rather than simply showing the price of an asset, it calculates a smoothed "momentum score" that fluctuates between 0 and 100, making it easier to identify periods of significant strength or weakness.
Core Logic Overview
The script functions by analyzing the relationship between current price movements and historical trends over a specific period (defined by the user). It seeks to filter out "market noise"—the minor, insignificant fluctuations that can often mislead traders—to highlight the underlying direction of the market.
How it Processes Data
To arrive at its final output, the script performs several layers of mathematical processing:
- Trend Smoothing: The tool takes the closing prices of the market and applies a series of weighted calculations. This ensures that the resulting line is smooth and not overly reactive to every tiny tick in price.
- Relative Movement Analysis: It compares current price changes against recent historical averages. By looking at these differences, it determines if the current move is accelerating or decelerating.
- Weighted Dynamics: The logic employs a multi-stage calculation where it takes the "velocity" of the price and passes it through several filters. These filters help establish how much of the recent movement is a sustained trend versus a temporary spike.
- Normalized Scoring: Finally, the script converts these complex movements into a simple percentage-based scale (0 to 100).
Visual Interpretation
The result is displayed in a separate window below the main price chart:
- The Neutral Zone: When the market is moving sideways or lacking clear momentum, the indicator tends to settle around the 50.0 level.
- Momentum Identification: When the indicator moves significantly above 50, it suggests upward pressure. When it drops significantly below 50, it indicates downward pressure.
- Boundary Limits: The logic is capped at 0 and 100, providing a clear "ceiling" and "floor" for traders to observe extreme market conditions.
In essence, this tool acts as a filter that translates raw price data into a readable momentum gauge, helping users see the "speed" and "strength" of a trend at a glance.
//+------------------------------------------------------------------+
//|                                                          rsx.mq4 |
//|                Copyright © 2005, Nick Bilak, beluck[AT]gmail.com |
//|                                    http://metatrader.50webs.com/ |
//+------------------------------------------------------------------+
#property copyright "Copyright © 2005, Nick Bilak"
#property link      "http://metatrader.50webs.com/"

#property indicator_separate_window
#property indicator_buffers 1
#property indicator_color1 Magenta
#property indicator_level1 70
#property indicator_level2 30
#property indicator_level3 50
#property indicator_maximum 100
#property indicator_minimum 0
//---- input parameters
extern int       Len=14;
//---- buffers
double rsx[];

double f88, f90;
double f0, v4, v8, vC, v10, v14, v18, v20;
double f8, f10, f18, f20, f28, f30, f38, f48, v1C;
double f50, f58, f60, f68, f70, f78, f80, f40;

//+------------------------------------------------------------------+
//| Custom indicator initialization function                         |
//+------------------------------------------------------------------+
int init()
  {
//---- indicators
   SetIndexStyle(0,DRAW_LINE);
   SetIndexBuffer(0,rsx);
   IndicatorShortName("rsxc("+Len+")");
//----
   return(0);
  }
//+------------------------------------------------------------------+
//| Custor indicator deinitialization function                       |
//+------------------------------------------------------------------+
int deinit()
  {
   return(0);
  }
//+------------------------------------------------------------------+
//| Custom indicator iteration function                              |
//+------------------------------------------------------------------+
int start()
  {

   int counted_bars=IndicatorCounted(),limit,shift;

   if (counted_bars<0) return(-1);
   if (counted_bars>0) counted_bars--;
   limit=Bars-Len-1;
   if(counted_bars>Len) limit=Bars-counted_bars-1;

   for (shift=limit;shift>=0;shift--)   {
      if (f90 == 0.0) {
         f90 = 1.0;
         f0 = 0.0;
         if (Len-1 >= 5) f88 = Len-1.0; else f88 = 5.0;
         f8 = 100.0*(Close[shift]);
         f18 = 3.0 / (Len + 2.0);
         f20 = 1.0 - f18;
      } else {
         if (f88 <= f90)
            f90 = f88 + 1;
         else
            f90 = f90 + 1;
         f10 = f8;
         f8  = 100*Close[shift];
         v8  = f8 - f10;
         f28 = f20 * f28 + f18 * v8;
         f30 = f18 * f28 + f20 * f30;
         vC  = f28 * 1.5 - f30 * 0.5;
         f38 = f20 * f38 + f18 * vC;
         f40 = f18 * f38 + f20 * f40;
         v10 = f38 * 1.5 - f40 * 0.5;
         f48 = f20 * f48 + f18 * v10;
         f50 = f18 * f48 + f20 * f50;
         v14 = f48 * 1.5 - f50 * 0.5;
         f58 = f20 * f58 + f18 * MathAbs(v8);
         f60 = f18 * f58 + f20 * f60;
         v18 = f58 * 1.5 - f60 * 0.5;
         f68 = f20 * f68 + f18 * v18;
         f70 = f18 * f68 + f20 * f70;
         v1C = f68 * 1.5 - f70 * 0.5;
         f78 = f20 * f78 + f18 * v1C;
         f80 = f18 * f78 + f20 * f80;
         v20 = f78 * 1.5 - f80 * 0.5;
         if ((f88 >= f90) && (f8 != f10)) f0 = 1.0;
         if ((f88 == f90) && (f0 == 0.0)) f90 = 0.0;
      }

      if ((f88 < f90) && (v20 > 0.0000000001)) {
         v4 = (v14 / v20 + 1.0) * 50.0;
         if (v4 > 100.0) v4 = 100.0;
         if (v4 < 0.0) v4 = 0.0;
      } else {
         v4 = 50.0;
      }

      rsx[shift]=v4;
   }
   return(0);
  }
Comments