rsx_v1
Download script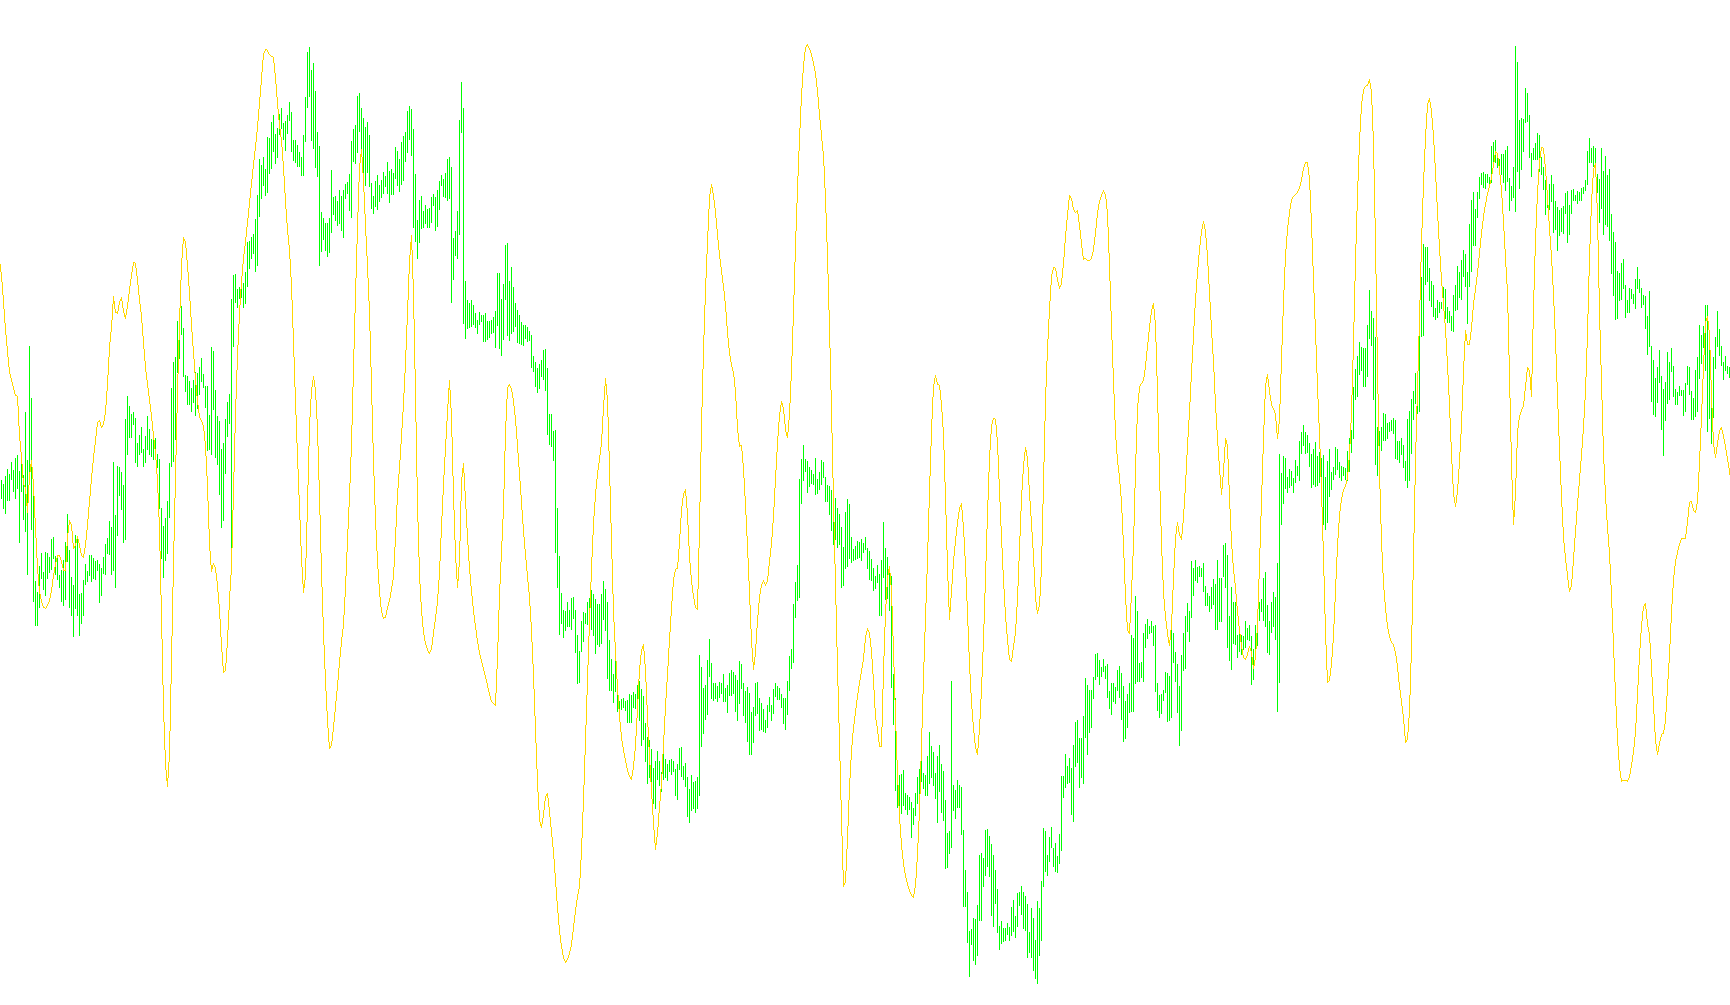
This script is a technical analysis tool designed for the MetaTrader trading platform to help users visualize market momentum and price velocity. It functions as a "momentum oscillator," which translates complex price fluctuations into a smoother, more readable line on a separate window below your main chart.
Core Logic and Functionality
1. Data Processing & Smoothing The script focuses on the relationship between high and low prices over a specific period (defined by the user). It calculates the "range" of price movement at each interval and applies a series of multi-layered smoothing calculations. By processing these values through several internal stages, the tool filters out "market noise"—those small, erratic price jumps that can often confuse traders—leaving behind a clearer picture of the prevailing trend.
2. Velocity Measurement Beyond just looking at price direction, the logic measures how fast the price is moving. It evaluates the change in price momentum relative to its recent history. The script essentially tracks the "acceleration" of the market; if the price is moving aggressively in one direction, the indicator reflects this strength.
3. Normalization and Scaling To make the data easy for a human to interpret, the script normalizes all the raw mathematical calculations into a fixed scale between 0 and 100:
- The Center Line (50): This acts as the equilibrium point. When the indicator is at 50, the market is considered neutral or sideways.
- Upper and Lower Boundaries: The script uses pre-defined levels (typically 70 for overbought/strong momentum and 30 for oversold/weak momentum) to help users identify when a trend might be becoming overextended.
4. Dynamic Response The logic is designed to stay at the 50% equilibrium line during periods of low volatility or consolidation. However, as soon as significant directional momentum is detected, the line reacts by moving toward either the top (100) or bottom (0) of the window. This allows traders to quickly distinguish between a "boring" market and one that is actively trending.
Summary for the User
Think of this tool as a speedometer for the market. Rather than just telling you if the price is going up or down, it tells you how much "power" is behind the move. It smooths out the jagged edges of price action to provide a steady visual guide, helping you stay aligned with the dominant trend while identifying potential turning points.
//+------------------------------------------------------------------+
//|                                                          rsx.mq4 |
//|                Copyright © 2005, Nick Bilak, beluck[AT]gmail.com |
//+------------------------------------------------------------------+
#property copyright "Copyright © 2005, Nick Bilak"
#property link      "http://metatrader.50webs.com/"

#property indicator_separate_window
#property indicator_buffers 1
#property indicator_color1 Magenta
#property indicator_level1 70
#property indicator_level2 30
#property indicator_level3 50
#property indicator_maximum 100
#property indicator_minimum 0
//---- input parameters
extern int       Len=14;
//---- buffers
double rsx[];

double f88, f90;
double f0, v4, v8, vC, v10, v14, v18, v20;
double f8, f10, f18, f20, f28, f30, f38, f48, v1C;
double f50, f58, f60, f68, f70, f78, f80, f40;

//+------------------------------------------------------------------+
//| Custom indicator initialization function                         |
//+------------------------------------------------------------------+
int init()
  {
//---- indicators
   SetIndexStyle(0,DRAW_LINE);
   SetIndexBuffer(0,rsx);
   IndicatorShortName("rsx("+Len+")");
//----
   return(0);
  }
//+------------------------------------------------------------------+
//| Custor indicator deinitialization function                       |
//+------------------------------------------------------------------+
int deinit()
  {
   return(0);
  }
//+------------------------------------------------------------------+
//| Custom indicator iteration function                              |
//+------------------------------------------------------------------+
int start()
  {

   int counted_bars=IndicatorCounted(),limit,shift;

   if (counted_bars<0) return(-1);
   if (counted_bars>0) counted_bars--;
   limit=Bars-Len-1;
   if(counted_bars>Len) limit=Bars-counted_bars-1;
   if (limit<2) limit=100;

   for (shift=limit;shift>=0;shift--)   {
      if (f90 == 0.0) {
         f90 = 1.0;
         f0 = 0.0;
         if (Len-1 >= 5) f88 = Len-1.0; else f88 = 5.0;
         f8 = 100.0*(High[shift]+Low[shift]);
         f18 = 3.0 / (Len + 2.0);
         f20 = 1.0 - f18;
      } else {
         if (f88 <= f90)
            f90 = f88 + 1;
         else
            f90 = f90 + 1;
         f10 = f8;
         f8  = 100*(High[shift]+Low[shift]);
         v8  = f8 - f10;
         f28 = f20 * f28 + f18 * v8;
         f30 = f18 * f28 + f20 * f30;
         vC  = f28 * 1.5 - f30 * 0.5;
         f38 = f20 * f38 + f18 * vC;
         f40 = f18 * f38 + f20 * f40;
         v10 = f38 * 1.5 - f40 * 0.5;
         f48 = f20 * f48 + f18 * v10;
         f50 = f18 * f48 + f20 * f50;
         v14 = f48 * 1.5 - f50 * 0.5;
         f58 = f20 * f58 + f18 * MathAbs(v8);
         f60 = f18 * f58 + f20 * f60;
         v18 = f58 * 1.5 - f60 * 0.5;
         f68 = f20 * f68 + f18 * v18;
         f70 = f18 * f68 + f20 * f70;
         v1C = f68 * 1.5 - f70 * 0.5;
         f78 = f20 * f78 + f18 * v1C;
         f80 = f18 * f78 + f20 * f80;
         v20 = f78 * 1.5 - f80 * 0.5;
         if ((f88 >= f90) && (f8 != f10)) f0 = 1.0;
         if ((f88 == f90) && (f0 == 0.0)) f90 = 0.0;
      }

      if ((f88 < f90) && (v20 > 0.0000000001)) {
         v4 = (v14 / v20 + 1.0) * 50.0;
         if (v4 > 100.0) v4 = 100.0;
         if (v4 < 0.0) v4 = 0.0;
      } else {
         v4 = 50.0;
      }

      rsx[shift]=v4;
   }
   return(0);
  }
Comments