Turbo_JRSX
Download script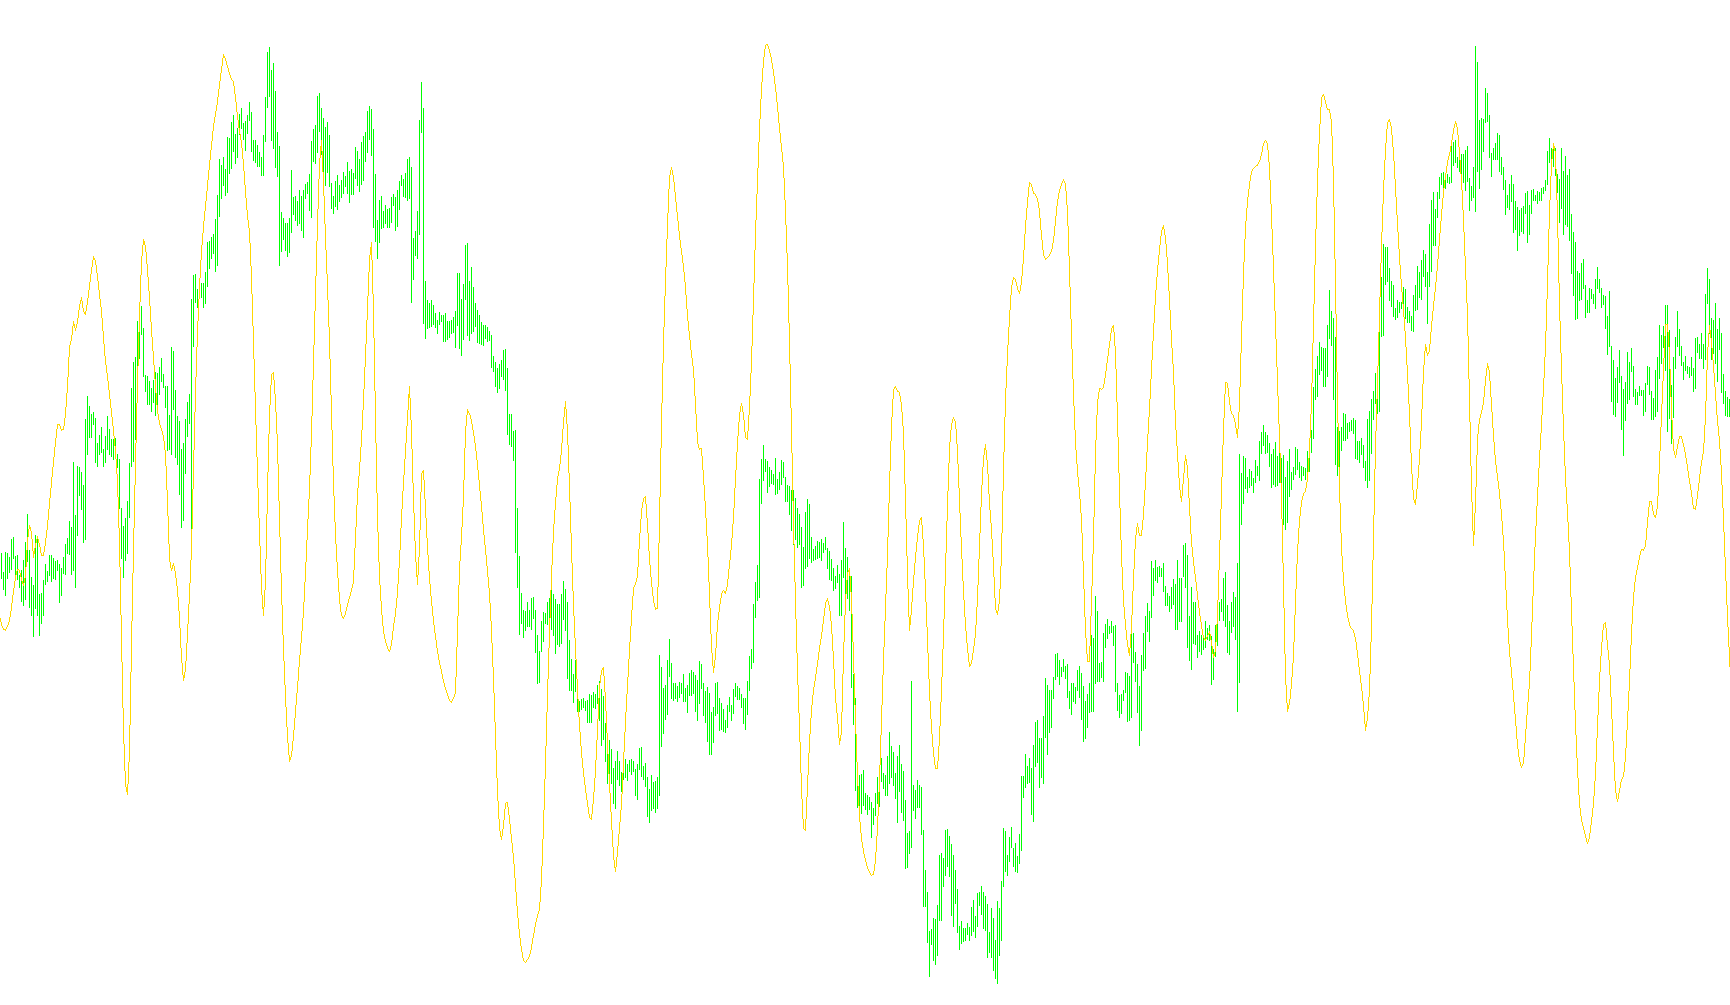
This technical indicator is designed to provide traders with a visual representation of market momentum and price velocity. By operating in a separate window, it allows for the observation of trend strength independently of the main price action.
Core Calculation Logic
The script identifies trends by analyzing price movement over a specific period (the "Length" parameter). Unlike standard indicators that might only look at the closing price, this tool utilizes the Typical Price, which is calculated as the average of the high, low, and close prices for each bar. This provides a more balanced view of market activity during a given timeframe.
The Momentum Mechanism
To generate its visual output, the logic performs several internal steps:
- Smoothing and Weighting: The script applies a series of recursive calculations to smooth out "noise" from the market. It takes the difference between the current price and the previous price and processes it through multiple layers of weighting. This helps in identifying the underlying direction of the market while filtering out minor, insignificant fluctuations.
- Velocity Tracking: It measures how quickly the price is moving in a specific direction. By comparing various weighted averages of these movements, the indicator determines the "force" behind a current trend.
- Relative Scaling: The logic converts these complex internal calculations into a standardized scale ranging from 0 to 100. This allows traders to see the momentum as a percentage-like value.
Visual Interpretation
The resulting line on your chart represents the market's momentum:
- The Center Line (50): This acts as the equilibrium point. When the line is at 50, it suggests neutral momentum.
- Upper and Lower Boundaries (70 and 30): These serve as key levels for identifying extreme momentum.
- Dynamic Positioning: The indicator dynamically adjusts its position based on the calculated velocity of the price. If the price is moving strongly in one direction, the line will shift toward the top or bottom of the window; if the momentum stalls or reverses, the line will gravitate back toward the center.
In summary, this script acts as a "speedometer" for the market, helping traders visualize whether a trend is gaining strength, losing steam, or remaining stagnant by analyzing the average price behavior over time.
#property copyright "strategybuilderfx.com - modified by bluto to use typical price (HLC/3)"
#property link "finger"
#property indicator_separate_window
#property indicator_buffers 1
#property indicator_color1 Magenta
#property indicator_level1 70
#property indicator_level2 30
#property indicator_level3 50
#property indicator_maximum 100
#property indicator_minimum 0

//---- input parameters
extern int Len=14; //---- buffers
double rsx[];


int init() {
   SetIndexStyle(0,DRAW_LINE);
   SetIndexBuffer(0,rsx);
   IndicatorShortName("Turbo_JRSX");
   return(0);
}

int deinit()
{
   return(0);
}

int start()
{

   double f88, f90;
   double f0, v4, v8, vC, v10, v14, v18, v20;
   double f8, f10, f18, f20, f28, f30, f38, f48, v1C;
   double f50, f58, f60, f68, f70, f78, f80, f40;

   //int counted_bars = IndicatorCounted(),limit,shift;

   //if (counted_bars<0) return(-1);
   //if (counted_bars>0) counted_bars--;
   double limit=Bars-(Len)-1;

   //if(counted_bars>Len) limit=Bars-counted_bars-1;

   for (int shift=limit;shift>=0;shift--) {
      if (f90 == 0.0) {

         f90 = 1.0;
         f0 = 0.0;
         if (Len-1 >= 5) f88 = Len-1.0; else f88 = 5.0;
 //      f8 = 100.0*(Close[shift]);
 //
 //      Modified for median price
 //
         f8 = 100.0*((High[shift]+Low[shift]+Close[shift])/3);
         f18 = 3.0 / (Len + 2.0);
         f20 = 1.0 - f18;

      } else{
         if (f88 <= f90) f90 = f88 + 1; else f90 = f90 + 1;
         f10 = f8;
 //      f8 = 100*Close[shift];
         f8 = 100.0*((High[shift]+Low[shift]+Close[shift])/3);
         v8 = f8 - f10;
         f28 = f20 * f28 + f18 * v8;
         f30 = f18 * f28 + f20 * f30;
         vC = f28 * 1.5 - f30 * 0.5;
         f38 = f20 * f38 + f18 * vC;
         f40 = f18 * f38 + f20 * f40;
         v10 = f38 * 1.5 - f40 * 0.5;
         f48 = f20 * f48 + f18 * v10;
         f50 = f18 * f48 + f20 * f50;
         v14 = f48 * 1.5 - f50 * 0.5;
         f58 = f20 * f58 + f18 * MathAbs(v8);
         f60 = f18 * f58 + f20 * f60;
         v18 = f58 * 1.5 - f60 * 0.5;
         f68 = f20 * f68 + f18 * v18;

         f70 = f18 * f68 + f20 * f70;
         v1C = f68 * 1.5 - f70 * 0.5;
         f78 = f20 * f78 + f18 * v1C;
         f80 = f18 * f78 + f20 * f80;
         v20 = f78 * 1.5 - f80 * 0.5;

         if ((f88 >= f90) && (f8 != f10)) f0 = 1.0;
         if ((f88 == f90) && (f0 == 0.0)) f90 = 0.0;
      }

      if ((f88 < f90) && (v20 > 0.0000000001)) {

         v4 = (v14 / v20 + 1.0) * 50.0;
         if (v4 > 100.0) v4 = 100.0;
         if (v4 < 0.0) v4 = 0.0;

      } else {
         v4 = 50.0;
      }

      rsx[shift]=v4;
   }

   return(0);

}
Comments