RSX[1]
Download script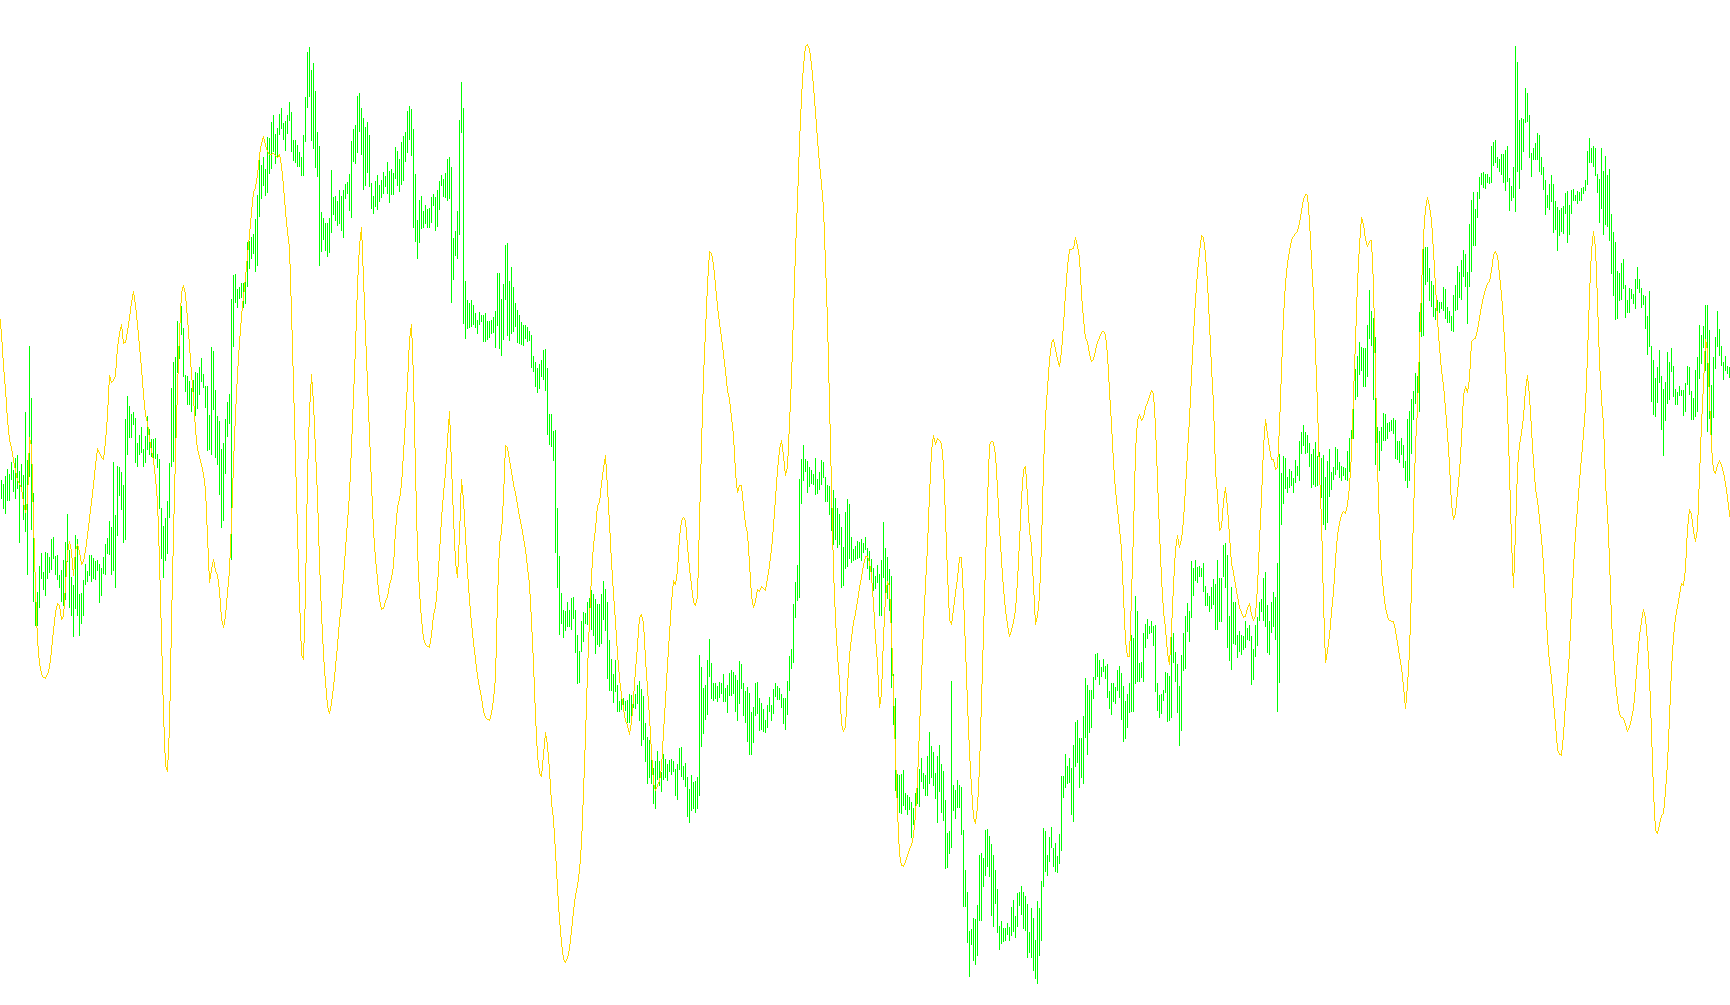
This tool is a custom technical analysis indicator designed to provide visual insights into the momentum and relative strength of a financial asset. It operates on a scale from 0 to 100, displayed in a separate window below your main price chart, making it easier to identify specific market trends without cluttering the primary price action.
Core Logic and Functionality
The indicator works by analyzing historical price data over a specific period (defined by the "Len" parameter, which defaults to 14 units). Its primary objective is to smooth out market noise and calculate a standardized momentum value that reflects whether the current price movement is accelerating or decelerating.
How it processes data:
- Price Smoothing: Instead of looking at raw, jagged price spikes, the script applies a series of complex smoothing calculations. It takes the closing prices of recent candles and blends them together to create a stabilized view of the asset's path.
- Momentum Tracking: The logic tracks the "velocity" of price changes. By comparing current price movements against previous ones through multiple layers of calculation, it determines the underlying strength of the trend.
- Dynamic Scaling: The final result is normalized to a 0–100 scale. This allows traders to see the market's "intensity" as a percentage-like value rather than an abstract currency figure.
Visual Interpretation
The indicator provides three primary horizontal reference levels to help you make informed trading decisions:
- The 50 Level (Midpoint): This represents the equilibrium point. When the indicator is above 50, it generally suggests that the bullish momentum is stronger than the bearish momentum.
- The 70 and 30 Levels: These act as potential "thresholds." When the indicator moves toward the upper extreme (70), it indicates a high degree of upward momentum; when it moves toward the lower extreme (30), it signals strong downward pressure.
Summary for the User
In simple terms, this script acts like a "speedometer" for the market. It filters out the constant minor fluctuations of price to show you the true direction and strength of the trend. By observing where the magenta line sits in relation to the 30, 50, and 70 levels, you can better gauge whether a trend is gaining steam or beginning to exhaust itself.
#property copyright "strategybuilderfx.com"
#property link "finger"
#property indicator_separate_window
#property indicator_buffers 1
#property indicator_color1 Magenta
#property indicator_level1 70
#property indicator_level2 30
#property indicator_level3 50
#property indicator_maximum 100
#property indicator_minimum 0

//---- input parameters
extern int Len=14; //---- buffers
double rsx[];


int init() {
   SetIndexStyle(0,DRAW_LINE);
   SetIndexBuffer(0,rsx);
   IndicatorShortName("RSX");
   return(0);
}

int deinit()
{
   return(0);
}

int start()
{

   double f88, f90;
   double f0, v4, v8, vC, v10, v14, v18, v20;
   double f8, f10, f18, f20, f28, f30, f38, f48, v1C;
   double f50, f58, f60, f68, f70, f78, f80, f40;

   //int counted_bars = IndicatorCounted(),limit,shift;

   //if (counted_bars<0) return(-1);
   //if (counted_bars>0) counted_bars--;
   double limit=Bars-(Len)-1;

   //if(counted_bars>Len) limit=Bars-counted_bars-1;

   for (int shift=limit;shift>=0;shift--) {
      if (f90 == 0.0) {

         f90 = 1.0;
         f0 = 0.0;
         if (Len-1 >= 5) f88 = Len-1.0; else f88 = 5.0;
         f8 = 100.0*(Close[shift]);
         f18 = 3.0 / (Len + 2.0);
         f20 = 1.0 - f18;

      } else{
         if (f88 <= f90) f90 = f88 + 1; else f90 = f90 + 1;
         f10 = f8;
         f8 = 100*Close[shift];
         v8 = f8 - f10;
         f28 = f20 * f28 + f18 * v8;
         f30 = f18 * f28 + f20 * f30;
         vC = f28 * 1.5 - f30 * 0.5;
         f38 = f20 * f38 + f18 * vC;
         f40 = f18 * f38 + f20 * f40;
         v10 = f38 * 1.5 - f40 * 0.5;
         f48 = f20 * f48 + f18 * v10;
         f50 = f18 * f48 + f20 * f50;
         v14 = f48 * 1.5 - f50 * 0.5;
         f58 = f20 * f58 + f18 * MathAbs(v8);
         f60 = f18 * f58 + f20 * f60;
         v18 = f58 * 1.5 - f60 * 0.5;
         f68 = f20 * f68 + f18 * v18;

         f70 = f18 * f68 + f20 * f70;
         v1C = f68 * 1.5 - f70 * 0.5;
         f78 = f20 * f78 + f18 * v1C;
         f80 = f18 * f78 + f20 * f80;
         v20 = f78 * 1.5 - f80 * 0.5;

         if ((f88 >= f90) && (f8 != f10)) f0 = 1.0;
         if ((f88 == f90) && (f0 == 0.0)) f90 = 0.0;
      }

      if ((f88 < f90) && (v20 > 0.0000000001)) {

         v4 = (v14 / v20 + 1.0) * 50.0;
         if (v4 > 100.0) v4 = 100.0;
         if (v4 < 0.0) v4 = 0.0;

      } else {
         v4 = 50.0;
      }

      rsx[shift]=v4;
   }

   return(0);

}
Comments