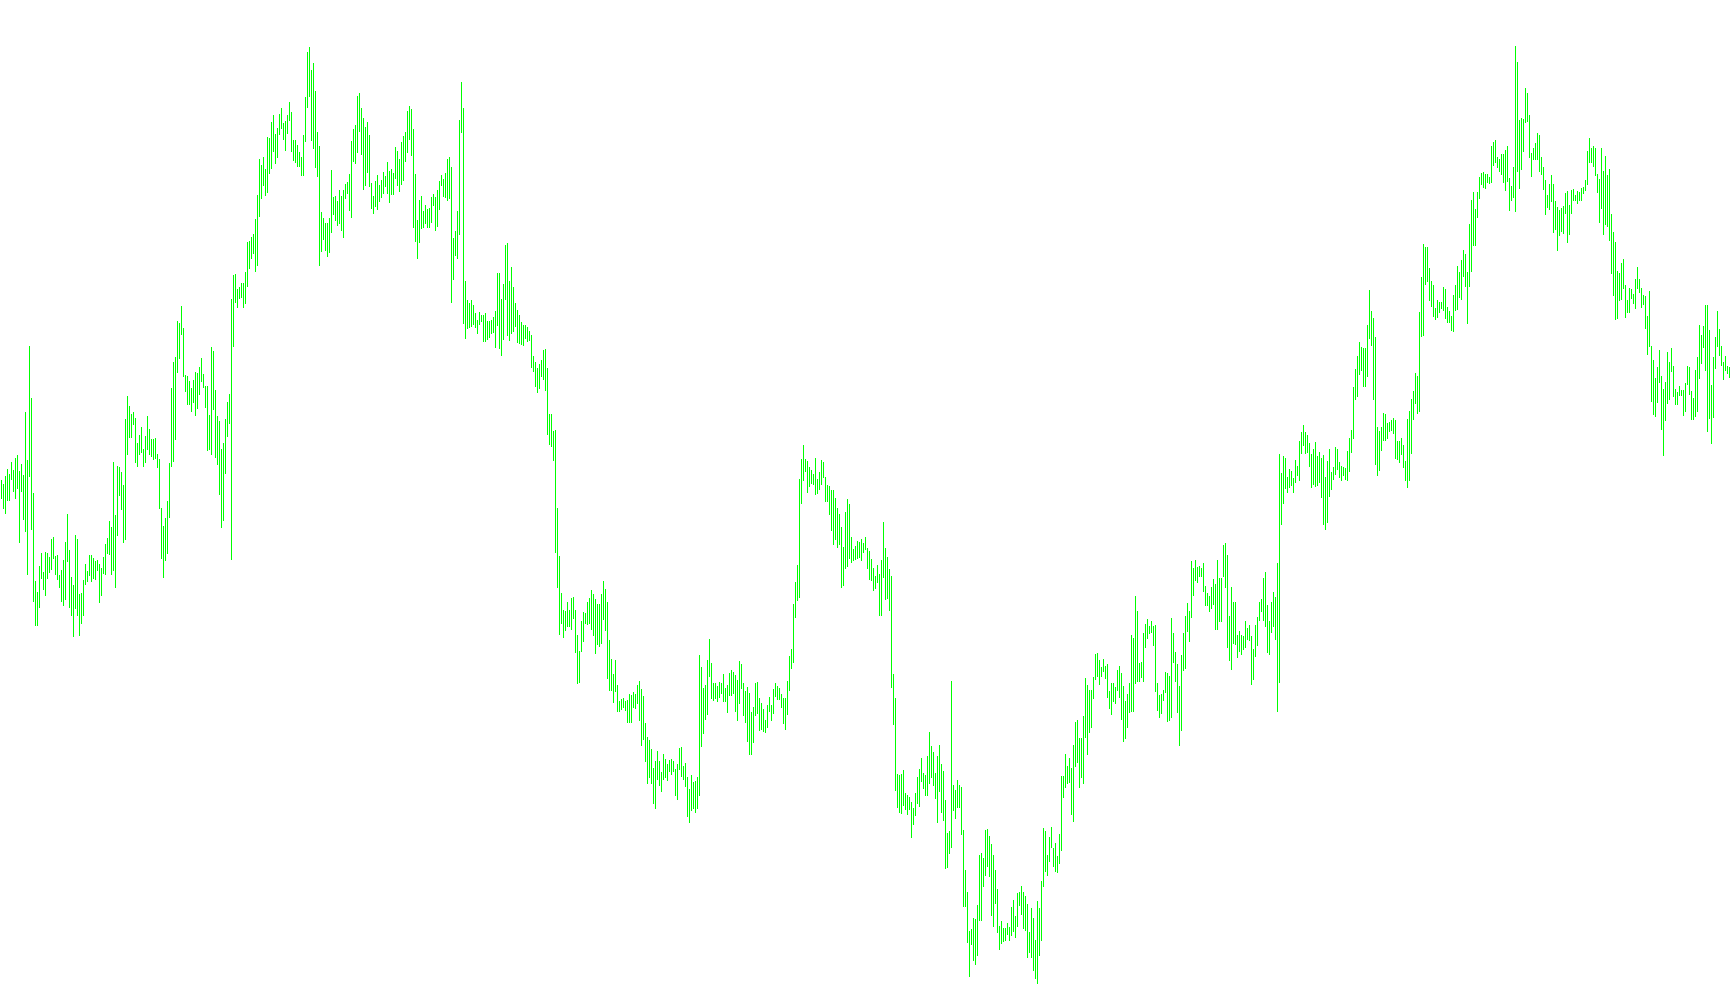
The Commodity Channel Index (CCI) is a technical analysis tool designed to measure the current price of a security relative to its average price over a specific period. It helps traders determine whether an asset is overbought, oversold, or trading at a normal level by calculating the "mean deviation" of price.
How the Logic Works
The script processes market data through a multi-step mathematical sequence to generate the visual histogram you see on your chart:
1. Establishing the Baseline (Moving Average) First, the tool identifies the "Typical Price" for each candle by averaging the High, Low, and Closing prices. It then calculates a Simple Moving Average (SMA) based on a user-defined period (defaulting to 21). This acts as the baseline or "fair value" of the asset.
2. Measuring Price Deviation The logic then looks at how far the actual price has wandered away from that baseline. It calculates the difference between the Typical Price and the Moving Average for every candle in the selected period, converting these differences into absolute values (ignoring whether the price is above or below the average).
3. Calculating the Standard Deviation The script aggregates all those individual differences to find a "Mean Deviation." This represents the typical "swing" or volatility of the price during that timeframe. By multiplying this by a specific constant, the tool establishes a benchmark for what constitutes a "normal" price fluctuation.
4. Determining the Final Index (CCI) Finally, the script compares the current price's distance from the average against the calculated standard deviation.
- If the current price is very far from the average compared to its normal volatility, the CCI value will be high.
- If the price is very close to the average, the CCI value will remain near zero.
Visual Representation
The resulting data is plotted as a histogram in a separate window below your main price chart. Because it focuses on relative deviation rather than absolute price, it allows traders to see momentum and identify potential trend reversals by spotting extreme peaks or valleys in the indicator's movement.
//+------------------------------------------------------------------+
//|                                                          SCCI.mq4 |
//|                      Copyright © 2004, MetaQuotes Software Corp. |
//|                                       http://www.metaquotes.net/ |
//+------------------------------------------------------------------+
#property copyright "Copyright © 2004, MetaQuotes Software Corp."
#property link      "http://www.metaquotes.net/"
//----
#property indicator_separate_window
#property indicator_buffers 1
#property indicator_color1 LightSeaGreen
//---- input parameters
extern int CCIPeriod = 21;
//---- buffers
double CCIBuffer[];
double RelBuffer[];
double DevBuffer[];
double MovBuffer[];
//+------------------------------------------------------------------+
//| Custom indicator initialization function                         |
//+------------------------------------------------------------------+
int init()
  {
   string short_name;
//---- 3 additional buffers are used for counting.
   IndicatorBuffers(4);
   SetIndexBuffer(1, RelBuffer);
   SetIndexBuffer(2, DevBuffer);
   SetIndexBuffer(3, MovBuffer);
//---- indicator lines
   SetIndexStyle(0, DRAW_HISTOGRAM);
   SetIndexBuffer(0, CCIBuffer);
//----
   if(CCIPeriod <= 0)
       CCIPeriod = 21;
//----
   SetIndexDrawBegin(0, CCIPeriod);

//---- name for DataWindow and indicator subwindow label
   short_name="CCI(" + CCIPeriod + ")";
   IndicatorShortName(short_name);
   SetIndexLabel(0, short_name);
//----
   return(0);
  }
//+------------------------------------------------------------------+
//| Commodity Channel Index                                          |
//+------------------------------------------------------------------+
int start()
  {
   int    i, k, counted_bars = IndicatorCounted();
   double price, sum, mul;
   if(CCIPeriod <= 1)
       return(0);
   if(Bars <= CCIPeriod)
       return(0);
//---- initial zero
   if(counted_bars < 1)
     {
       for(i = 1; i <= CCIPeriod; i++)
           CCIBuffer[Bars-i] = 0.0;
       for(i = 1; i <= CCIPeriod; i++)
           DevBuffer[Bars-i] = 0.0;
       for(i = 1; i <= CCIPeriod; i++)
           MovBuffer[Bars-i] =0.0;
     }
//---- last counted bar will be recounted
   int limit = Bars - counted_bars;
   if(counted_bars > 0)
       limit++;
//---- moving average
   for(i = 0; i < limit; i++)
       MovBuffer[i] = iMA(NULL, 0, CCIPeriod, 0, MODE_SMA, PRICE_TYPICAL, i);
//---- standard deviations
   i = Bars - CCIPeriod + 1;
   if(counted_bars > CCIPeriod - 1)
       i = Bars - counted_bars - 1;
   mul = 0.015 / CCIPeriod;
   while(i >= 0)
     {
       sum = 0.0;
       k = i + CCIPeriod - 1;
       while(k >= i)
        {
          price =(High[k] + Low[k] + Close[k]) / 3;
          sum += MathAbs(price - MovBuffer[i]);
          k--;
        }
       DevBuffer[i] = sum*mul;
       i--;
     }
   i = Bars - CCIPeriod + 1;
   if(counted_bars > CCIPeriod - 1)
       i = Bars - counted_bars - 1;
   while(i >= 0)
     {
       price = (High[i] + Low[i] + Close[i]) / 3;
       RelBuffer[i] = price - MovBuffer[i];
       i--;
     }
//---- cci counting
   i = Bars - CCIPeriod + 1;
   if(counted_bars > CCIPeriod - 1)
       i = Bars - counted_bars - 1;
   while(i >= 0)
     {
       if(DevBuffer[i] == 0.0)
           CCIBuffer[i] = 0.0;
       else
           CCIBuffer[i] = RelBuffer[i] / DevBuffer[i];
       i--;
     }
//----
   return(0);
  }
//+------------------------------------------------------------------+
Comments