Silence
Download script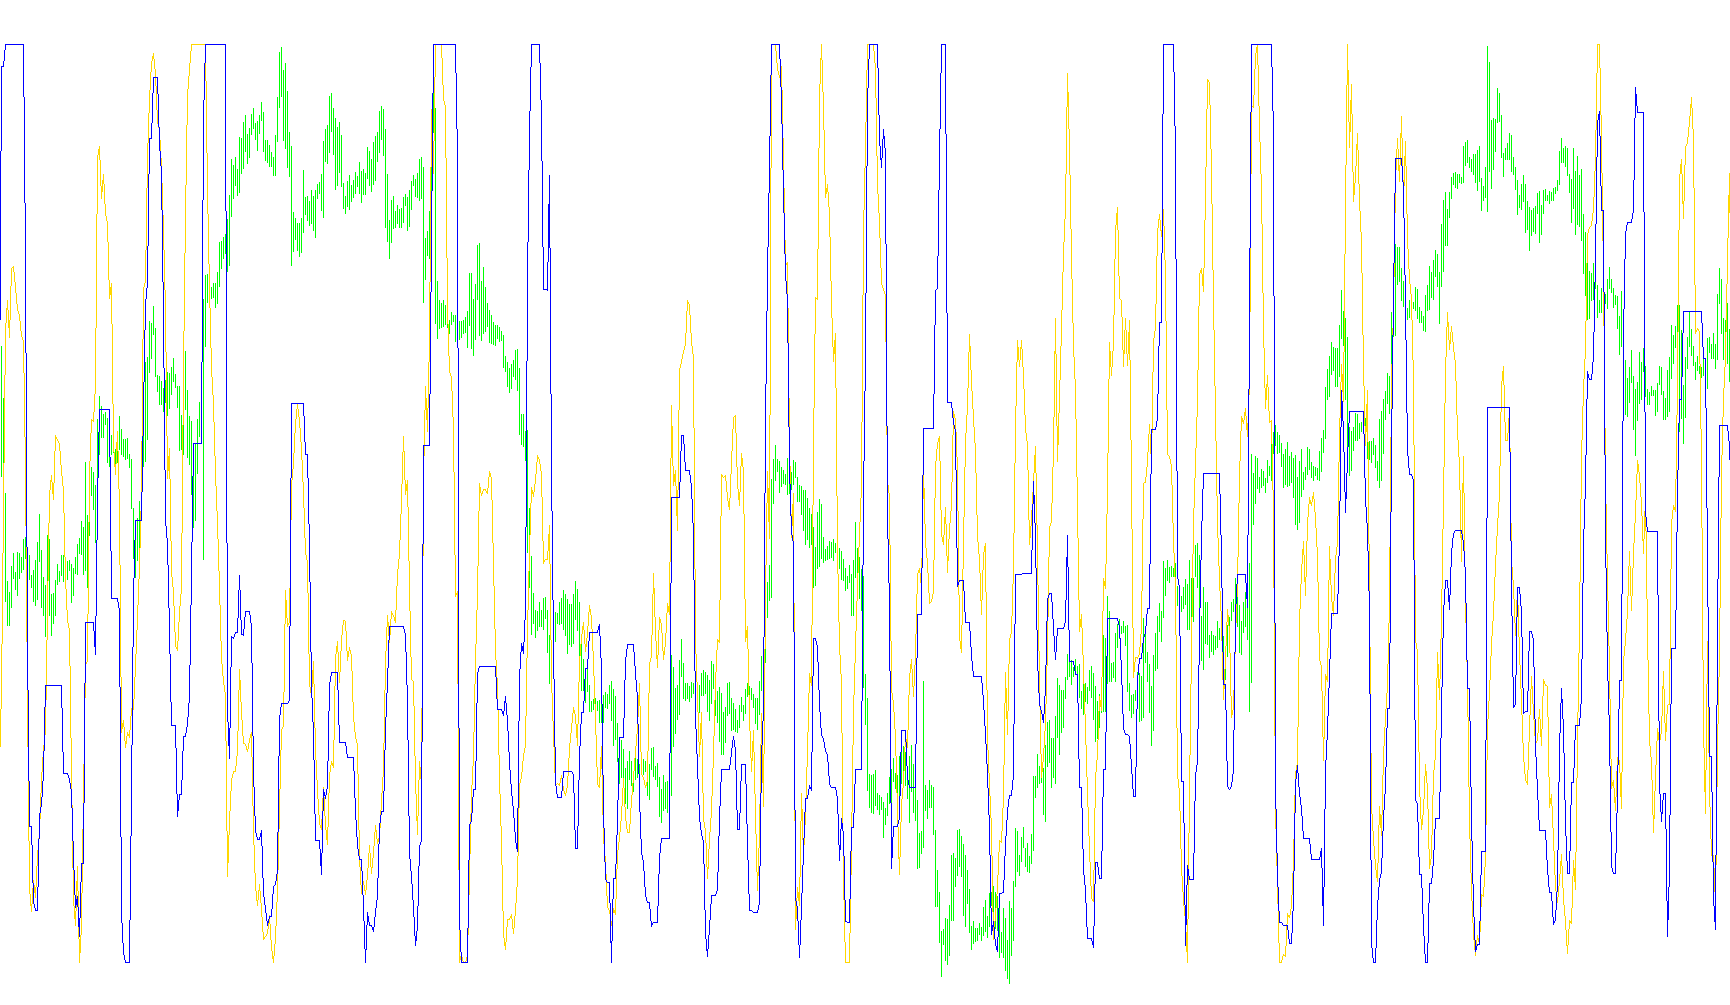
This script is designed to provide a visual representation of market activity by tracking two specific metrics: Aggressiveness and Volatility. It translates complex price movements into a percentage scale (0 to 100), allowing traders to see how "active" or "unstable" the market is at any given moment.
Core Logic Overview
The script analyzes price history over a user-defined period to calculate two distinct indicators:
1. Aggressiveness (Blue Line) This metric measures the speed and momentum of price changes.
- How it works: The logic looks at the price movement from one candle to the next. It differentiates between "bullish" movements (where the price closes higher) and "bearish" movements (where the price closes lower).
- The Result: By calculating the cumulative change over a set number of bars, it determines how forcefully the market is moving in a specific direction. A high percentage indicates a strong, rapid trend, while a lower percentage suggests a sluggish or stagnant market.
2. Volatility (Maroon Line) This metric measures the "width" or the range of price movement, rather than just the speed.
- How it works: The script identifies the highest peak and the lowest valley reached during a specific time window.
- The Result: It calculates the distance between that high and low point. A high percentage signifies a wide "trading corridor," meaning the price is swinging significantly back and forth. A low percentage indicates that the price is staying within a very tight, stable range.
Key Functional Features
- Dynamic Scaling: Both indicators are automatically scaled to a 0–100% range. This means they are "normalized"—regardless of whether you are trading an asset with small price changes or large ones, the lines will always occupy the same visual space, making them easy to compare across different charts.
- Real-Time Updates: The script includes a toggle (ReDraw) that determines how the most recent data point is displayed. It can either update instantly as each new tick of price comes in or wait for a candle to close before finalizing the value.
- Visual Buffer: To ensure the data is smooth and relevant, the script maintains a "buffer" (a history of previous calculations), which helps in establishing the maximum and minimum points needed to calculate the current percentages accurately.
Summary for the User
In simple terms, this tool tells you how much "action" is happening right now. If both lines are high, the market is moving very fast and swinging widely. If the blue line is high but the maroon line is low, the market is moving aggressively in one steady direction. If the maroon line is high but the blue line is low, the market is swinging wildly but staying within a confined area.
//+---------------------------------------------------------------------+
//|                                                      Silence.mq4    |
//|                                         Copyright © Trofimov 2009   |
//+---------------------------------------------------------------------+
//| Òèøèíà                                                              |
//|                                                                     |
//| Îïèñàíèå: Ïîêàçûâàåò íà ñêîëüêî ïðîöåíòîâ àêòèâåí ðûíîê             |
//| Ñèíÿÿ - ïðîöåíò àãðåññèâíîñòè (ñêîðîñòè èçìåíåíèÿ öåíû)             |
//| Êðàñíàÿ - ïðîöåíò âîëàòèëüíîñòè (âåëè÷èíà êîðèäîðà)                 |
//| Àâòîðñêîå ïðàâî ïðèíàäëåæèò Òðîôèìîâó Åâãåíèþ Âèòàëüåâè÷ó, 2009     |
//+---------------------------------------------------------------------+


#property copyright "Copyright © Trofimov Evgeniy Vitalyevich, 2009"
#property link      "http://TrofimovVBA.narod.ru/"

//---- Ñâîéñòâà èíäèêàòîðà
#property indicator_separate_window
#property indicator_buffers 2
#property indicator_color1 MidnightBlue
#property indicator_width1 1
#property indicator_color2 Maroon
#property indicator_width2 1
#property indicator_maximum 100
#property indicator_minimum 0
#property indicator_level1 50

//---- Âõîäÿùèå ïàðàìåòðû
extern int MyPeriod=12;
extern int BuffSize=96;
bool ReDraw=true; //-åñëè âêëþ÷åí, òî ïåðåðèñîâûâàåò íóëåâîé áàð ïðè êàæäîì íîâîì òèêå
// åñëè âûêëþ÷åí, òî íóëåâîé áàð ñîäåðæèò ôèêñèðîâàííîå çíà÷åíèå, âû÷èñëåííîå ïî ïðåäûäóùèì (ãîòîâûì) áàðàì
double Buff_line1[]; // - àãðåññèâíîñòü
double Buff_line2[]; // - âîëàòèëüíîñòü
double Aggress[], Volatility[];
//+------------------------------------------------------------------+
//|                Ôóíêöèÿ èíèöèàëèçàöèè èíäèêàòîðà                  |
//+------------------------------------------------------------------+
int init()
  {
//---- x äîïîëíèòåëüíûõ áóôåðà, èñïîëüçóåìûõ äëÿ ðàñ÷åòà
   IndicatorBuffers(2);
   IndicatorDigits(2);
//---- ïàðàìåòðû ðèñîâàíèÿ (óñòàíîâêà íà÷àëüíîãî áàðà)
   SetIndexDrawBegin(0,BuffSize+MyPeriod);
   SetIndexDrawBegin(1,BuffSize+MyPeriod);
//---- x ðàñïðåäåëåííûõ áóôåðà èíäèêàòîðà
   SetIndexBuffer(0,Buff_line1);
   SetIndexBuffer(1,Buff_line2);
//---- èìÿ èíäèêàòîðà è ïîäñêàçêè äëÿ ëèíèé
   IndicatorShortName("Silence("+MyPeriod+","+BuffSize+") = ");
   SetIndexLabel(0,"Aggressiveness");
   SetIndexLabel(1,"Volatility");
   ArrayResize(Aggress,BuffSize);
   ArrayResize(Volatility,BuffSize);
   return(0);
  }
//+------------------------------------------------------------------+
//|                Ôóíêöèÿ èíäèêàòîðà                                |
//+------------------------------------------------------------------+
int start() {
   static datetime LastTime;
   int limit, RD;
   double MAX,MIN;
   double upPrice,downPrice;
   if(ReDraw) RD=1;
   // Ïðîïóùåííûå áàðû
   int counted_bars=IndicatorCounted();
//---- îáõîäèì âîçìîæíûå îøèáêè
   if(counted_bars<0) return(-1);
//---- íîâûå áàðû íå ïîÿâèëèñü è ïîýòîìó íè÷åãî ðèñîâàòü íå íóæíî
   limit=Bars-counted_bars-1+RD;
//---- îñíîâíûå ïåðåìåííûå
   double B;
//---- îñíîâíîé öèêë
   for(int t=limit-RD; t>-RD; t--) {

      //Âû÷èñëåíèå àãðåññèâíîñòè áàðà t
      B=0;
      for(int x=t+MyPeriod-1; x>=t; x--) {
         if(Close[x]>Open[x]) {
            //áåëàÿ ñâå÷à
            B=B+(Close[x]-Close[x+1]);
         }else{
            //÷¸ðíàÿ ñâå÷à
            B=B+(Close[x+1]-Close[x]);
         }
      }//Next x

      //Âû÷èñëåíèå âîëàòèëüíîñòè áàðà t
      upPrice=High[iHighest(Symbol(),0,MODE_HIGH,MyPeriod,t)];//ìàêñèìóì çà N áàðîâ
      downPrice=Low[iLowest(Symbol(),0,MODE_LOW,MyPeriod,t)]; //ìèíèìóì çà N áàðîâ

      //Åñëè îáðàçîâàëñÿ íîâûé áàð, òî ïðîèçâîäèòñÿ ñäâèæêà ìàññèâà
      if(LastTime!=Time[t+1]){
         for(x=BuffSize-1; x>0; x--) {
            Aggress[x]=Aggress[x-1];
            Volatility[x]=Volatility[x-1];
         }//Next x
         LastTime=Time[t+1];
      }
      //Êîíåö ñäâèæêè ìàññèâà

      //Ïåðåðèñîâêà àãðåññèâíîñòè
      Aggress[0]=B/Point/MyPeriod;
      MAX=Aggress[ArrayMaximum(Aggress)];
      MIN=Aggress[ArrayMinimum(Aggress)];
      Buff_line1[t]=Èíòåðïîëÿöèÿ(MAX,MIN,100,0,Aggress[0]);
      if(!ReDraw && t==1) Buff_line1[0]=Buff_line1[1];
      //Êîíåö ïåðåðèñîâêà àãðåññèâíîñòè

      //Ïåðåðèñîâêà âîëàòèëüíîñòè
      Volatility[0]=(upPrice-downPrice)/Point/MyPeriod;
      MAX=Volatility[ArrayMaximum(Volatility)];
      MIN=Volatility[ArrayMinimum(Volatility)];
      Buff_line2[t]=Èíòåðïîëÿöèÿ(MAX,MIN,100,0,Volatility[0]);
      if(!ReDraw && t==1) Buff_line2[0]=Buff_line2[1];
      //Êîíåö ïåðåðèñîâêà âîëàòèëüíîñòè

   }//Next t
   return(0);
}
//+------------------------------------------------------------------+
double Èíòåðïîëÿöèÿ(double a,double b,double c,double d,double X) {
//a; X; b - ñòîëáåö èçâåòíûõ ÷èñåë, c; d; - ñòîëáåö ñî ñòîðîíû íåèçâåñòíîé.
    if(b - a == 0)
        return(10000000); //áåñêîíå÷íîñòü
    else
        return(d - (b - X) * (d - c) / (b - a));
}//Èíòåðïîëÿöèÿ
//+------------------------------------------------------------------+
Comments