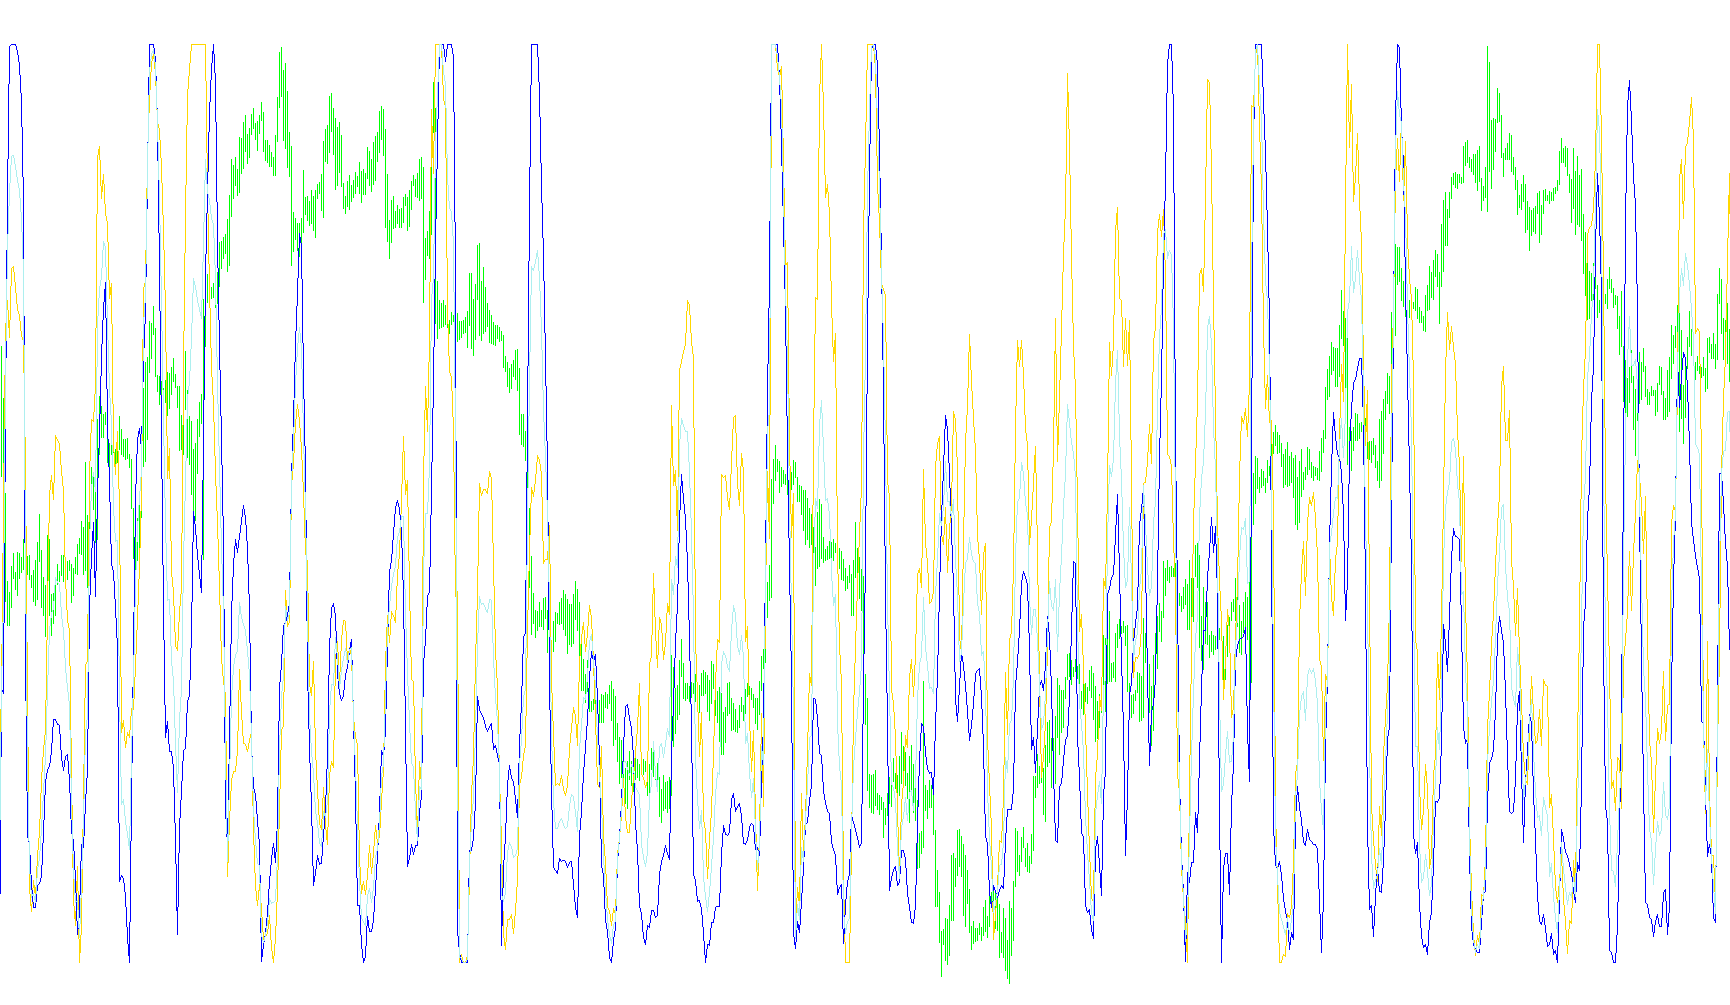
This script is a specialized market analysis tool designed to visualize the intensity and activity level of a financial market. Instead of showing price directly, it translates raw market movements into three distinct percentage-based metrics, allowing traders to see how "active" or "volatile" the market is at any given moment.
The logic operates through three primary components:
1. Aggressiveness (Blue Line)
This metric measures the speed and strength of price movement. The script examines a set period of recent bars to determine how much the price is pushing in a specific direction. It calculates the net displacement of the price, essentially distinguishing between "pushing" movements and "receding" movements. By normalizing this data into a percentage, it shows you how aggressively the market is trying to move toward a certain target.
2. Volatility (Red Line)
This metric focuses on the consistency and variance of price actions rather than just the direction. It uses a standard deviation logic, which looks at how much the current price fluctuates away from its recent average. A high percentage here indicates that the market is "noisy" or experiencing wide swings, while a low percentage suggests that prices are staying very close to their moving average.
3. The Middle Average (Dark Green Line)
This is a balanced overview of the market state. It takes the results from both the Aggressiveness and Volatility metrics and calculates their mathematical mean. This provides a single unified "activity score" that combines both the intensity of the trend and the variance of the price movements into one readable line.
Key Technical Behaviors
- Percentage Scaling: All three metrics are scaled to a 0–100% range. This makes it easy for users to understand the market state at a glance—the higher the lines, the more active the market is; the lower the lines, the "quieter" or calmer the market remains.
- Dynamic Recalculation: The script includes an option to either update the data in real-time with every tick (providing a live, moving view) or lock the values once a candle is closed (providing a more stable, historical view).
- Historical Buffer: The tool maintains a "memory" of recent market data. By keeping a buffer of past movements, it can accurately calculate current percentages based on relative highs and lows, ensuring that the percentages remain meaningful even as market conditions change rapidly.
//+---------------------------------------------------------------------+
//|                                                      Silence.mq4    |
//|                                         Copyright © Trofimov 2009   |
//+---------------------------------------------------------------------+
//| Òèøèíà                                                              |
//|                                                                     |
//| Îïèñàíèå: Ïîêàçûâàåò íà ñêîëüêî ïðîöåíòîâ àêòèâåí ðûíîê             |
//| Ñèíÿÿ - ïðîöåíò àãðåññèâíîñòè (ñêîðîñòè èçìåíåíèÿ öåíû)             |
//| Êðàñíàÿ - ïðîöåíò âîëàòèëüíîñòè (ïî èíäèêàòîðó StdDev)              |
//| Àâòîðñêîå ïðàâî ïðèíàäëåæèò Òðîôèìîâó Åâãåíèþ Âèòàëüåâè÷ó, 2009     |
//+---------------------------------------------------------------------+

//=============================================================================================================================
// Äîðàáîòêà èíäèêàòîðà DS dolsergon@yandex.ru
// äîáàâëåíà ñðåäíÿÿ ìåæäó äâóõ ëèíèé
#property copyright "Copyright © Trofimov Evgeniy, 2009"
#property link      "http://www.mql4.com/ru/users/EvgeTrofi"

//---- Ñâîéñòâà èíäèêàòîðà
#property indicator_separate_window
#property indicator_buffers 3
#property indicator_color1 Blue
#property indicator_width1 1
#property indicator_color2 Red
#property indicator_width2 1
#property indicator_color3 DarkGreen
#property indicator_width3 1
#property indicator_maximum 100
#property indicator_minimum 0
#property indicator_level1 70

//---- Âõîäÿùèå ïàðàìåòðû
extern int MyPeriod=12;
extern int BuffSize=96;
bool ReDraw=true; //-åñëè âêëþ÷åí, òî ïåðåðèñîâûâàåò íóëåâîé áàð ïðè êàæäîì íîâîì òèêå
// åñëè âûêëþ÷åí, òî íóëåâîé áàð ñîäåðæèò ôèêñèðîâàííîå çíà÷åíèå, âû÷èñëåííîå ïî ïðåäûäóùèì (ãîòîâûì) áàðàì
double Buff_line1[]; // - àãðåññèâíîñòü
double Buff_line2[]; // - âîëàòèëüíîñòü
double Buff_line3[]; // - îáùåå ñðåäíåå
double Aggress[], Volatility[];
//+------------------------------------------------------------------+
//|                Ôóíêöèÿ èíèöèàëèçàöèè èíäèêàòîðà                  |
//+------------------------------------------------------------------+
int init()
  {
//---- x äîïîëíèòåëüíûõ áóôåðà, èñïîëüçóåìûõ äëÿ ðàñ÷åòà
   IndicatorBuffers(3);
   IndicatorDigits(2);
//---- ïàðàìåòðû ðèñîâàíèÿ (óñòàíîâêà íà÷àëüíîãî áàðà)
   SetIndexDrawBegin(0,BuffSize+MyPeriod);
   SetIndexDrawBegin(1,BuffSize+MyPeriod);
   SetIndexDrawBegin(2,BuffSize+MyPeriod);
//---- x ðàñïðåäåëåííûõ áóôåðà èíäèêàòîðà
   SetIndexBuffer(0,Buff_line1);
   SetIndexBuffer(1,Buff_line2);
   SetIndexBuffer(2,Buff_line3);
//---- èìÿ èíäèêàòîðà è ïîäñêàçêè äëÿ ëèíèé
   IndicatorShortName("Silence2("+MyPeriod+","+BuffSize+") = ");
   SetIndexLabel(0,"Aggressiveness");
   SetIndexLabel(1,"Volatility");
   SetIndexLabel(2,"Middle");
   ArrayResize(Aggress,BuffSize);
   ArrayResize(Volatility,BuffSize);
   return(0);
  }
//+------------------------------------------------------------------+
//|                Ôóíêöèÿ èíäèêàòîðà                                |
//+------------------------------------------------------------------+
int start() {
   static datetime LastTime;
   int limit, RD;
   double MAX,MIN;
   //double upPrice,downPrice;
   double dAmount,dMovingAverage,dAPrice;
   if(ReDraw) RD=1;
   // Ïðîïóùåííûå áàðû
   int counted_bars=IndicatorCounted();
//---- îáõîäèì âîçìîæíûå îøèáêè
   if(counted_bars<0) return(-1);
//---- íîâûå áàðû íå ïîÿâèëèñü è ïîýòîìó íè÷åãî ðèñîâàòü íå íóæíî
   limit=Bars-counted_bars-1+RD;
//---- îñíîâíûå ïåðåìåííûå
   double B;
//---- îñíîâíîé öèêë
   for(int t=limit-RD; t>-RD; t--) {

      //Âû÷èñëåíèå àãðåññèâíîñòè áàðà t
      B=0;
      for(int x=t+MyPeriod-1; x>=t; x--) {
         if(Close[x]>Open[x]) {
            //áåëàÿ ñâå÷à
            B=B+(Close[x]-Close[x+1]);
         }else{
            //÷¸ðíàÿ ñâå÷à
            B=B+(Close[x+1]-Close[x]);
         }
      }//Next x

      //Âû÷èñëåíèå âîëàòèëüíîñòè áàðà t
      //upPrice=High[iHighest(Symbol(),0,MODE_HIGH,MyPeriod,t)];//ìàêñèìóì çà N áàðîâ
      //downPrice=Low[iLowest(Symbol(),0,MODE_LOW,MyPeriod,t)]; //ìèíèìóì çà N áàðîâ
      dAmount=0.0;
      dMovingAverage=iMA(NULL,0,MyPeriod,0,0,0,t);
      for(x=t+MyPeriod-1; x>=t; x--)
        {
         dAPrice=Close[x];
         dAmount+=(dAPrice-dMovingAverage)*(dAPrice-dMovingAverage);
        }

      //Åñëè îáðàçîâàëñÿ íîâûé áàð, òî ïðîèçâîäèòñÿ ñäâèæêà ìàññèâà
      if(LastTime!=Time[t+1]){
         for(x=BuffSize-1; x>0; x--) {
            Aggress[x]=Aggress[x-1];
            Volatility[x]=Volatility[x-1];
         }//Next x
         LastTime=Time[t+1];
      }
      //Êîíåö ñäâèæêè ìàññèâà

      //Ïåðåðèñîâêà àãðåññèâíîñòè
      Aggress[0]=B/Point/MyPeriod;
      MAX=Aggress[ArrayMaximum(Aggress)];
      MIN=Aggress[ArrayMinimum(Aggress)];
      Buff_line1[t]=Èíòåðïîëÿöèÿ(MAX,MIN,100,0,Aggress[0]);
      if(!ReDraw && t==1) Buff_line1[0]=Buff_line1[1];
      //Êîíåö ïåðåðèñîâêà àãðåññèâíîñòè


      //Ïåðåðèñîâêà âîëàòèëüíîñòè
      Volatility[0]=MathSqrt(dAmount/MyPeriod);
      MAX=Volatility[ArrayMaximum(Volatility)];
      MIN=Volatility[ArrayMinimum(Volatility)];
      Buff_line2[t]=Èíòåðïîëÿöèÿ(MAX,MIN,100,0,Volatility[0]);
      Set_Line3(t);
      if(!ReDraw && t==1) {
      	Buff_line2[0]=Buff_line2[1];
      	Set_Line3(0);
      }
      //Êîíåö ïåðåðèñîâêà âîëàòèëüíîñòè

   }//Next t
   return(0);
}
//+------------------------------------------------------------------+
double Èíòåðïîëÿöèÿ(double a,double b,double c,double d,double X) {
//a; X; b - ñòîëáåö èçâåòíûõ ÷èñåë, c; d; - ñòîëáåö ñî ñòîðîíû íåèçâåñòíîé.
    if(b - a == 0)
        return(10000000); //áåñêîíå÷íîñòü
    else
        return(d - (b - X) * (d - c) / (b - a));
}//Èíòåðïîëÿöèÿ
//+------------------------------------------------------------------+


//===================================================================================
void Set_Line3(int pBar) {
	Buff_line3[pBar] = (Buff_line1[pBar] + Buff_line2[pBar]) / 2;
}
Comments