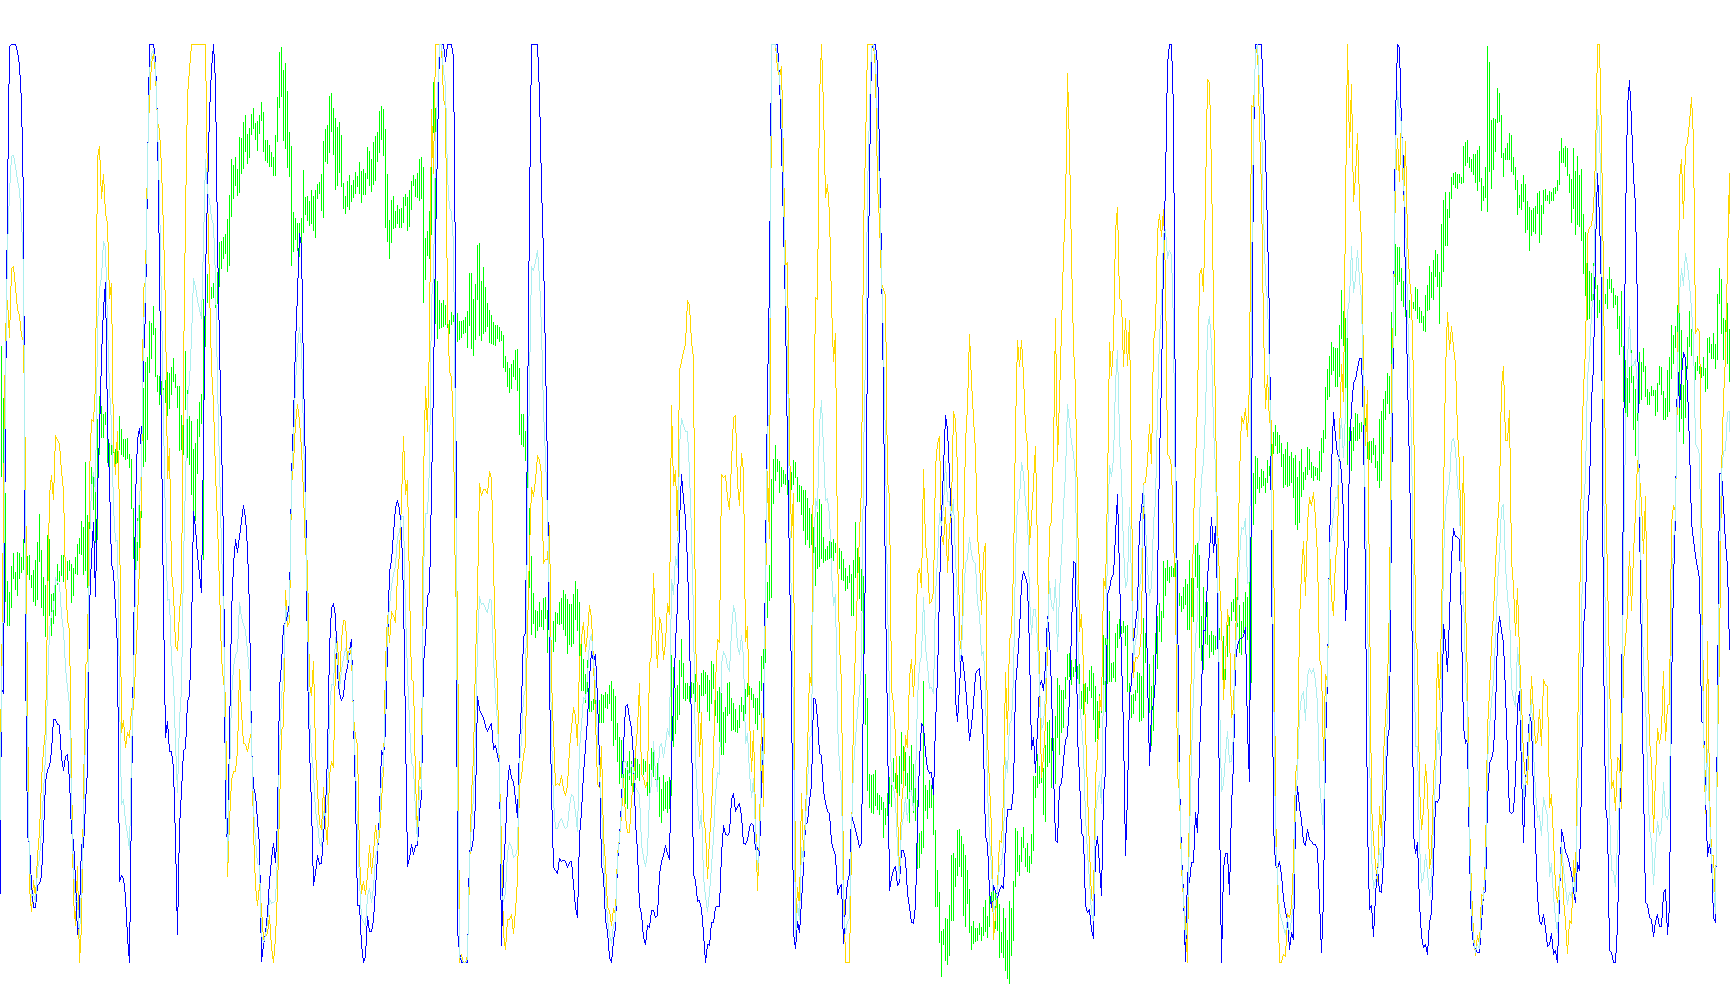
This script is designed to provide a visual representation of market activity by calculating and displaying three specific data points simultaneously. Instead of looking at standard price movements, it interprets the "mood" of the market based on the speed of price changes and the intensity of price fluctuations.
Core Logic Overview
The indicator functions by analyzing historical price data over a defined period to generate three distinct metrics:
1. Market Aggressiveness (Speed) This logic measures how quickly the price is moving in a specific direction. The script looks at a sequence of recent candles and calculates the net change in price for each one. By totaling these movements over the designated timeframe, it determines the "speed" or "aggression" of the current trend. If the market is pushing strongly in one direction, this value increases.
2. Market Volatility (Intensity) While aggressiveness measures speed, volatility measures the consistency and magnitude of price swings. The script calculates this by comparing the actual closing prices against a moving average. It determines how far the price deviates from its average trend over time. A high volatility score indicates that the market is experiencing significant, unpredictable swings, whereas a low score suggests a more stable, calmer environment.
3. The Mean Balance (Middle Line) To provide a balanced perspective, the script takes the results of both Aggressiveness and Volatility and calculates their average. This creates a "middle" line that represents the overall state of the market activity by blending speed and intensity into a single unified metric.
Data Visualization and Scaling
To make this information easy to read at a glance, the script performs several background processes:
- Normalization: Because raw price changes and volatility numbers can vary wildly across different assets (like currencies vs. gold), the script uses a mathematical technique to convert all results into a percentage scale from 0 to 100. This allows you to see where the current market activity stands relative to recent history.
- Dynamic Comparison: The indicator keeps a "memory" of previous values (a buffer). It identifies the highest and lowest levels reached within this memory to ensure that the current percentage is always scaled correctly against the most recent price action.
- Real-Time Updates: The script is designed to update continuously. Depending on your settings, it can either refresh the data instantly with every new tick of the market or wait until a candle has officially closed to provide a fixed value.
Summary for the User
In simple terms, this tool helps you see "how busy" the market is. It separates the speed of a move from the chaos of a move, providing a visual percentage that tells you if the market is currently calm, aggressively trending, or highly volatile.
//+---------------------------------------------------------------------+
//|                                                      Silence.mq4    |
//|                                         Copyright © Trofimov 2009   |
//+---------------------------------------------------------------------+
//| Òèøèíà                                                              |
//|                                                                     |
//| Îïèñàíèå: Ïîêàçûâàåò íà ñêîëüêî ïðîöåíòîâ àêòèâåí ðûíîê             |
//| Ñèíÿÿ - ïðîöåíò àãðåññèâíîñòè (ñêîðîñòè èçìåíåíèÿ öåíû)             |
//| Êðàñíàÿ - ïðîöåíò âîëàòèëüíîñòè (ïî èíäèêàòîðó StdDev)              |
//| Àâòîðñêîå ïðàâî ïðèíàäëåæèò Òðîôèìîâó Åâãåíèþ Âèòàëüåâè÷ó, 2009     |
//+---------------------------------------------------------------------+

//=============================================================================================================================
// Äîðàáîòêà èíäèêàòîðà DS dolsergon@yandex.ru
// äîáàâëåíà ñðåäíÿÿ ìåæäó äâóõ ëèíèé
#property copyright "Copyright © Trofimov Evgeniy, 2009"
#property link      "http://www.mql4.com/ru/users/EvgeTrofi"

//---- Ñâîéñòâà èíäèêàòîðà
#property indicator_separate_window
#property indicator_buffers 3
#property indicator_color1 CLR_NONE
#property indicator_width1 1
#property indicator_color2 Yellow
#property indicator_width2 1
#property indicator_color3 CLR_NONE
#property indicator_width3 2
#property indicator_maximum 100
#property indicator_minimum 0
#property indicator_level1 78

//---- Âõîäÿùèå ïàðàìåòðû
extern int MyPeriod=12;
extern int BuffSize=96;
bool ReDraw=true; //-åñëè âêëþ÷åí, òî ïåðåðèñîâûâàåò íóëåâîé áàð ïðè êàæäîì íîâîì òèêå
// åñëè âûêëþ÷åí, òî íóëåâîé áàð ñîäåðæèò ôèêñèðîâàííîå çíà÷åíèå, âû÷èñëåííîå ïî ïðåäûäóùèì (ãîòîâûì) áàðàì
double Buff_line1[]; // - àãðåññèâíîñòü
double Buff_line2[]; // - âîëàòèëüíîñòü
double Buff_line3[]; // - îáùåå ñðåäíåå
double Aggress[], Volatility[];
//+------------------------------------------------------------------+
//|                Ôóíêöèÿ èíèöèàëèçàöèè èíäèêàòîðà                  |
//+------------------------------------------------------------------+
int init()
  {
//---- x äîïîëíèòåëüíûõ áóôåðà, èñïîëüçóåìûõ äëÿ ðàñ÷åòà
   IndicatorBuffers(3);
   IndicatorDigits(2);
//---- ïàðàìåòðû ðèñîâàíèÿ (óñòàíîâêà íà÷àëüíîãî áàðà)
   SetIndexDrawBegin(0,BuffSize+MyPeriod);
   SetIndexDrawBegin(1,BuffSize+MyPeriod);
   SetIndexDrawBegin(2,BuffSize+MyPeriod);
//---- x ðàñïðåäåëåííûõ áóôåðà èíäèêàòîðà
   SetIndexBuffer(0,Buff_line1);
   SetIndexBuffer(1,Buff_line2);
   SetIndexBuffer(2,Buff_line3);
//---- èìÿ èíäèêàòîðà è ïîäñêàçêè äëÿ ëèíèé
   IndicatorShortName("Silence2("+MyPeriod+","+BuffSize+") = ");
   SetIndexLabel(0,"Aggressiveness");
   SetIndexLabel(1,"Volatility");
   SetIndexLabel(1,"Middle");
   ArrayResize(Aggress,BuffSize);
   ArrayResize(Volatility,BuffSize);
   return(0);
  }
//+------------------------------------------------------------------+
//|                Ôóíêöèÿ èíäèêàòîðà                                |
//+------------------------------------------------------------------+
int start() {
   static datetime LastTime;
   int limit, RD;
   double MAX,MIN;
   //double upPrice,downPrice;
   double dAmount,dMovingAverage,dAPrice;
   if(ReDraw) RD=1;
   // Ïðîïóùåííûå áàðû
   int counted_bars=IndicatorCounted();
//---- îáõîäèì âîçìîæíûå îøèáêè
   if(counted_bars<0) return(-1);
//---- íîâûå áàðû íå ïîÿâèëèñü è ïîýòîìó íè÷åãî ðèñîâàòü íå íóæíî
   limit=Bars-counted_bars-1+RD;
//---- îñíîâíûå ïåðåìåííûå
   double B;
//---- îñíîâíîé öèêë
   for(int t=limit-RD; t>-RD; t--) {

      //Âû÷èñëåíèå àãðåññèâíîñòè áàðà t
      B=0;
      for(int x=t+MyPeriod-1; x>=t; x--) {
         if(Close[x]>Open[x]) {
            //áåëàÿ ñâå÷à
            B=B+(Close[x]-Close[x+1]);
         }else{
            //÷¸ðíàÿ ñâå÷à
            B=B+(Close[x+1]-Close[x]);
         }
      }//Next x

      //Âû÷èñëåíèå âîëàòèëüíîñòè áàðà t
      //upPrice=High[iHighest(Symbol(),0,MODE_HIGH,MyPeriod,t)];//ìàêñèìóì çà N áàðîâ
      //downPrice=Low[iLowest(Symbol(),0,MODE_LOW,MyPeriod,t)]; //ìèíèìóì çà N áàðîâ
      dAmount=0.0;
      dMovingAverage=iMA(NULL,0,MyPeriod,0,0,0,t);
      for(x=t+MyPeriod-1; x>=t; x--)
        {
         dAPrice=Close[x];
         dAmount+=(dAPrice-dMovingAverage)*(dAPrice-dMovingAverage);
        }

      //Åñëè îáðàçîâàëñÿ íîâûé áàð, òî ïðîèçâîäèòñÿ ñäâèæêà ìàññèâà
      if(LastTime!=Time[t+1]){
         for(x=BuffSize-1; x>0; x--) {
            Aggress[x]=Aggress[x-1];
            Volatility[x]=Volatility[x-1];
         }//Next x
         LastTime=Time[t+1];
      }
      //Êîíåö ñäâèæêè ìàññèâà

      //Ïåðåðèñîâêà àãðåññèâíîñòè
      Aggress[0]=B/Point/MyPeriod;
      MAX=Aggress[ArrayMaximum(Aggress)];
      MIN=Aggress[ArrayMinimum(Aggress)];
      Buff_line1[t]=Èíòåðïîëÿöèÿ(MAX,MIN,100,0,Aggress[0]);
      if(!ReDraw && t==1) Buff_line1[0]=Buff_line1[1];
      //Êîíåö ïåðåðèñîâêà àãðåññèâíîñòè


      //Ïåðåðèñîâêà âîëàòèëüíîñòè
      Volatility[0]=MathSqrt(dAmount/MyPeriod);
      MAX=Volatility[ArrayMaximum(Volatility)];
      MIN=Volatility[ArrayMinimum(Volatility)];
      Buff_line2[t]=Èíòåðïîëÿöèÿ(MAX,MIN,100,0,Volatility[0]);
      Set_Line3(t);
      if(!ReDraw && t==1) {
      	Buff_line2[0]=Buff_line2[1];
      	Set_Line3(0);
      }
      //Êîíåö ïåðåðèñîâêà âîëàòèëüíîñòè

   }//Next t
   return(0);
}
//+------------------------------------------------------------------+
double Èíòåðïîëÿöèÿ(double a,double b,double c,double d,double X) {
//a; X; b - ñòîëáåö èçâåòíûõ ÷èñåë, c; d; - ñòîëáåö ñî ñòîðîíû íåèçâåñòíîé.
    if(b - a == 0)
        return(10000000); //áåñêîíå÷íîñòü
    else
        return(d - (b - X) * (d - c) / (b - a));
}//Èíòåðïîëÿöèÿ
//+------------------------------------------------------------------+


//===================================================================================
void Set_Line3(int pBar) {
	Buff_line3[pBar] = (Buff_line1[pBar] + Buff_line2[pBar]) / 2;
}
Comments