SilverTrend rewritten by CrazyChart
Download script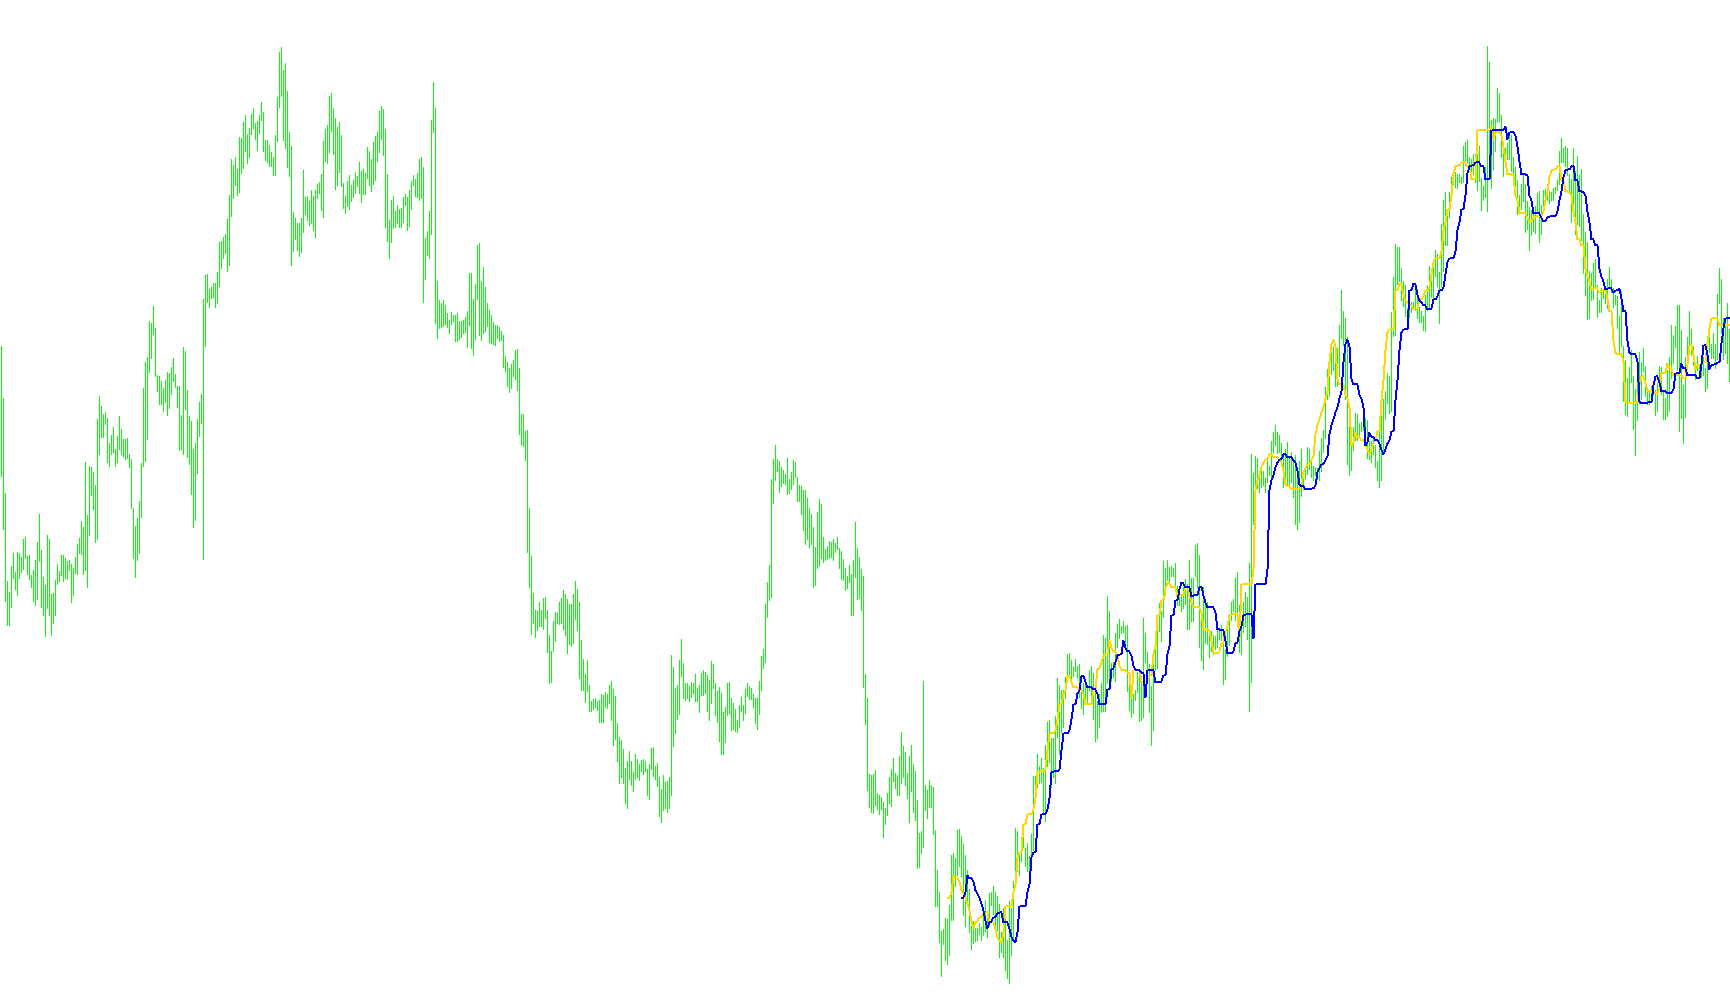
This tool is designed to analyze market trends by identifying specific price boundaries based on historical price action. Its primary goal is to provide visual cues and real-time notifications when the market moves into favorable "buy" or "sell" zones.
How the Logic Works
The script operates by scanning a specific number of previous price candles (the lookback period) to determine the prevailing highs and lows. It then calculates two dynamic boundary lines based on these extremes:
- Price Extremes: The tool first identifies the highest peak and the lowest valley within a set window of time.
- Boundary Calculation: Using these peaks and valleys, it calculates two separate price levels. These levels are determined by applying specific percentages to the range between the high and the low.
- Trend Identification: The logic compares these calculated boundaries against each other in real-time. By observing how these levels shift or cross one another, the tool identifies changes in market momentum.
Visual and Audible Feedback
To make this data actionable for a trader, the script provides three types of feedback:
- On-Chart Visualization: It plots two distinct lines on your chart (typically colored Blue and Red) that represent the calculated boundaries. These lines allow you to see the "zones" where the price is currently reacting.
- Screen Comments: The tool displays a text comment directly on the trading chart, indicating whether a specific "buy" or "sell" condition has been met based on the current boundary relationship.
- Real-Time Alerts: When the logic detects a significant shift—specifically when one boundary crosses another—the script can trigger an audible sound and a pop-up alert notification. This is designed to capture your attention immediately when a potential trade signal appears, ensuring you don't have to watch the screen constantly.
Key Summary
Essentially, this tool acts as a filter for market volatility. It simplifies complex price movements into two primary boundaries; when those boundaries cross or move in specific directions, it signals that the market may be entering a trend that favors either a long (buy) or short (sell) position.
//+------------------------------------------------------------------+
//|              Filename changed to ForexOFFTrend.mq4 by CrazyChart |
//|                                                 SilverTrend .mq4 |
//|                              SilverTrend rewritten by CrazyChart |
//|                                                  http://viac.ru/ |
//+------------------------------------------------------------------+

#property copyright "SilverTrend rewritten by CrazyChart"
#property link "http://viac.ru/ "
//----
#property indicator_chart_window
#property indicator_buffers 2
#property indicator_color1 Blue
#property indicator_color2 Red
//---- input parameters
extern int CountBars = 400;
extern int SSP = 7;
extern double Kmin = 1.6;
extern double Kmax = 50.6;
extern bool gAlert = True; // Switch to allow alerts
//---- buffers
double ExtMapBuffer1[];
double ExtMapBuffer2[];
//----
bool gSellAlertGiven = false; // Used to stop constant alerts
bool gBuyAlertGiven = false; // Used to stop constant alerts
//+------------------------------------------------------------------+
//| Custom indicator initialization function                         |
//+------------------------------------------------------------------+
int init()
  {
//---- indicators
   SetIndexStyle(0, DRAW_LINE, 0, 2);
   SetIndexBuffer(0, ExtMapBuffer1);
   SetIndexStyle(1, DRAW_LINE, 0, 2);
   SetIndexBuffer(1, ExtMapBuffer2);
//----
   if(CountBars >= Bars)
       CountBars = Bars;
   SetIndexDrawBegin(0, Bars - CountBars + SSP);
   SetIndexDrawBegin(1, Bars - CountBars + SSP);
//----
   return(0);
  }
//+------------------------------------------------------------------+
//| Custor indicator deinitialization function                       |
//+------------------------------------------------------------------+
int deinit()
  {
   return(0);
  }
//+------------------------------------------------------------------+
//| Custom indicator iteration function                              |
//+------------------------------------------------------------------+
int start()
  {
   int i,
   i2,
   loopbegin,
   counted_bars = IndicatorCounted();
   double SsMax,
   SsMin,
   K,
   val1,
   val2,
   smin,
   smax,
   price;
   if(Bars <= SSP + 1)
       return(0);
//---- initial zero
   if(counted_bars < SSP + 1)
     {
       for(i = 1; i <= SSP; i++)
           ExtMapBuffer1[CountBars-i] = 0.0;
       for(i = 1; i <= SSP; i++)
           ExtMapBuffer2[CountBars-i] = 0.0;
     }
   for(i = CountBars - SSP; i >= 0; i--)
     {
       SsMax = High[Highest(NULL, 0, MODE_HIGH, SSP, i - SSP + 1)];
       SsMin = Low[Lowest(NULL, 0, MODE_LOW, SSP, i - SSP + 1)];
       smin = NormalizeDouble((SsMin - (SsMax - SsMin)*Kmin / 100), Digits);
       smax = NormalizeDouble((SsMax - (SsMax - SsMin)*Kmax / 100), Digits);
       ExtMapBuffer1[i-SSP+6] = smax;
       ExtMapBuffer2[i-SSP-1] = smax;
       val1 = ExtMapBuffer1[0];
       val2 = ExtMapBuffer2[0];
       if(val1 > val2)
         {
           Comment("ïîêóïêà buy ", val1);
           if(gAlert == true && gBuyAlertGiven == false)
             {
               PlaySound("alert.wav");

               Alert("Buy signal at " + DoubleToStr(val1, Digits) + " on " + Period() +
                     " minute chart");
               gBuyAlertGiven = true;
               gSellAlertGiven = false;
             }
         }
       if(val1 < val2)
         {
           Comment("ïðîäàæà sell ", val2);
           if(gAlert == true && gSellAlertGiven == false)
             {
               PlaySound("alert.wav");
               Alert("Sell signal at " + DoubleToStr(val2, Digits) + " on " + Period()+
                     " minute chart");
               gBuyAlertGiven = false;
               gSellAlertGiven=true;
             }
         }
     }
//----
   return(0);
  }
//+------------------------------------------------------------------+
Comments