RSI_2SigMAs_mtf
Download script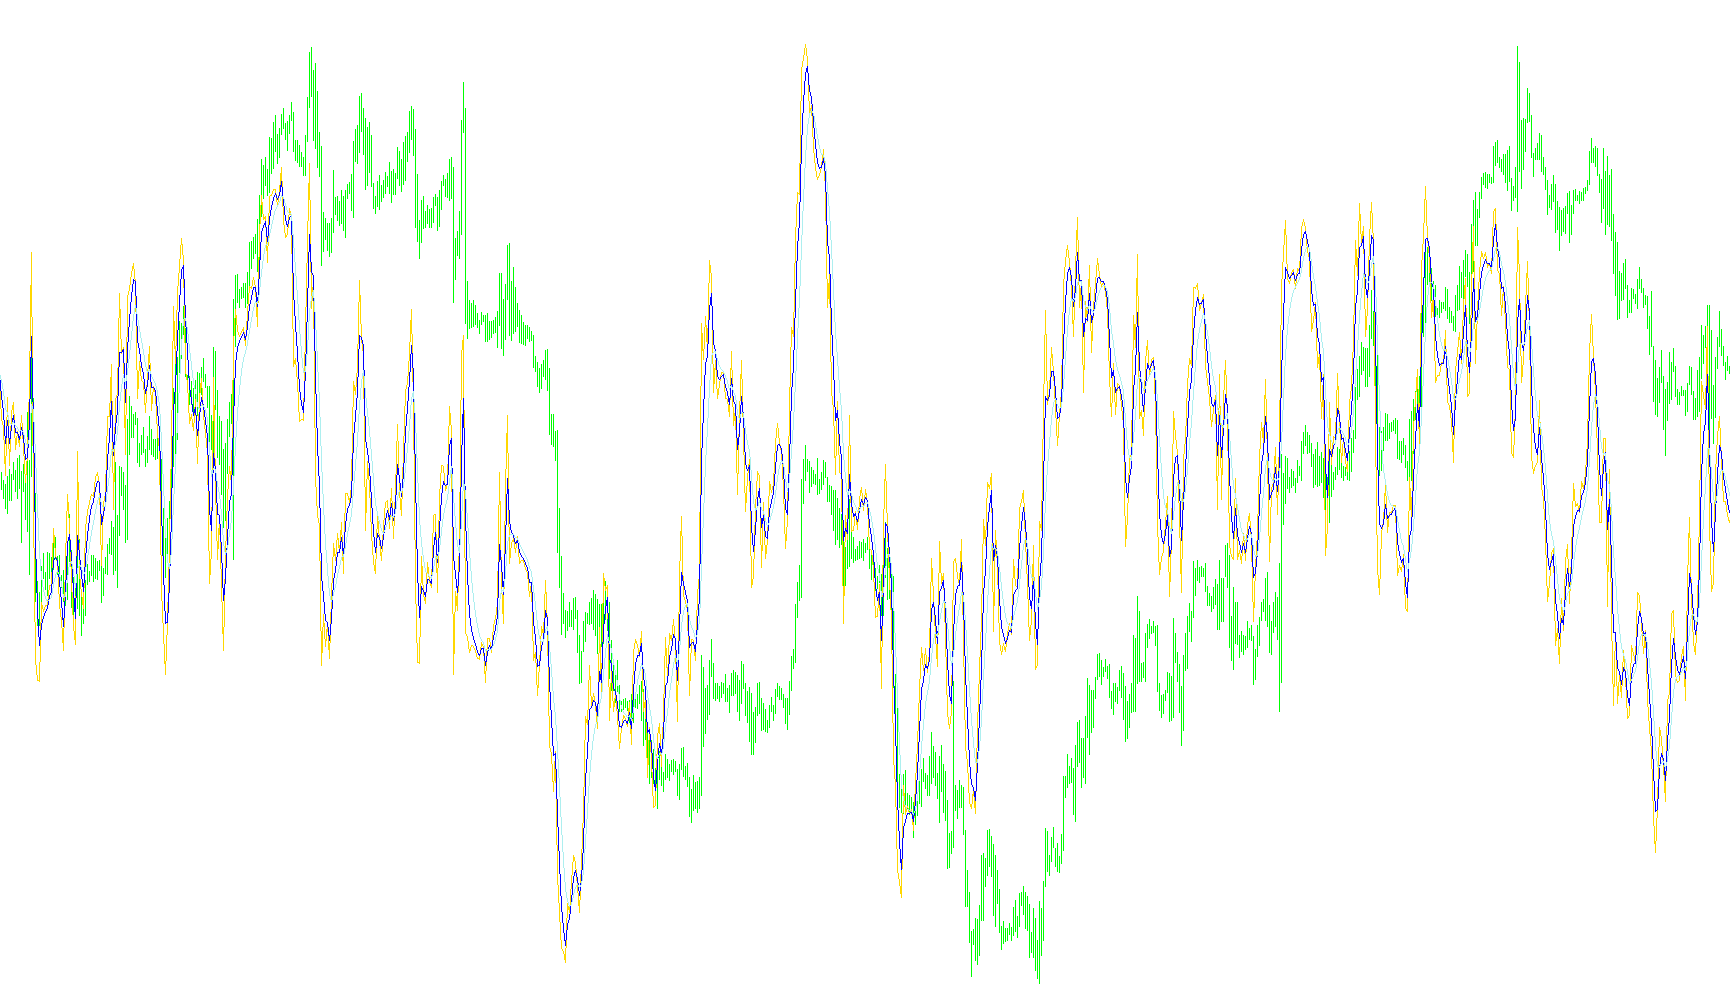
The RSI_2SigMAs_mtf is a sophisticated technical analysis tool designed to provide traders with a multi-layered view of market momentum. Rather than simply showing a standard Relative Strength Index (RSI), this script enhances the data by layering moving averages over it, allowing for a smoother, more filtered interpretation of price action across different timeframes.
Core Functionality
The logic operates through a three-step sequential processing system:
-
Multi-Timeframe RSI Calculation: The primary engine calculates the RSI based on user-defined periods (e.g., 14 days/minutes). A key feature of this script is its ability to pull data from different timeframes. This means you can view higher-level market trends (like Daily or Weekly momentum) while looking at a lower-level chart (like 5-minute or Hourly charts), providing a broader perspective on where the price is heading.
-
First Signal Smoothing (MA1): Once the RSI values are calculated, the script applies its first Moving Average (MA1) to those results. This acts as a "signal line." By smoothing out the raw RSI data, it helps eliminate "noise"—the small, jagged price fluctuations that can often lead to false signals—making it easier to identify the underlying trend of the momentum.
-
Second Signal Smoothing (MA2): To provide an even deeper level of analysis, the script applies a second Moving Average (MA2) to the already smoothed first signal. This creates a "double-filtered" result. The objective here is to identify major shifts in momentum. When both signals align, it provides a much clearer picture of whether the market is entering a strong trend or becoming exhausted.
Visual Layout and Navigation
- Independent Window: The indicator appears in a separate pane below the main price chart, ensuring it does not clutter your view of the candlesticks.
- Dynamic Labeling: The tool automatically updates its display name to show you exactly which periods and timeframes are currently being calculated, making it easy to manage multiple charts.
- Shift Options: The logic includes "shift" parameters, which allow users to visually offset the lines on the chart to better align with specific historical price points or to accommodate visual preferences.
Summary for the Trader
Essentially, this tool takes raw momentum data (RSI), cleans it up once (MA1), and then refines it again (MA2). By using these three layers together, it helps you distinguish between temporary price "hiccups" and actual, sustained changes in market strength across various time scales.
//+------------------------------------------------------------------+
//| RSI_2SigMAs_mtf                                           RSI.mq4 |
//|                      Copyright © 2005, MetaQuotes Software Corp. |
//|                                       http://www.metaquotes.net/ |
//+------------------------------------------------------------------+
//mtf2008fxtsd.com keris ki

#property copyright "Copyright © 2005, MetaQuotes Software Corp."
#property link      "http://www.metaquotes.net/"
//----

#property  indicator_separate_window

#property  indicator_buffers 3
#property  indicator_color1  RoyalBlue
#property  indicator_color2  Green
#property  indicator_color3  Red

#property indicator_width1 1
#property indicator_width2 2
#property indicator_width3 1

#property indicator_level1 70
#property indicator_level2 50
#property indicator_level3 30
#property indicator_levelcolor DarkOliveGreen
//----


extern int RSI_Period =14;
extern int RSI_Price  =0;
extern int RSI_shift  =0;
extern int RSI_x_shift=0;

extern int MA1_Period=3;
extern int MA1_Mode  =1;
extern int MA1_shift =0;
extern int MA1_x_shift=0;


extern int MA2_Period=5;
extern int MA2_Mode  =1;
extern int MA2_shift =0;
extern int MA2_x_shift=0;


double   RSI_Buffer[];
double   MA1_Buffer[];
double   MA2_Buffer[];

double   ExBuffer1[];
double   ExBuffer2[];


extern int TimeFrame=0;

extern string  TimeFrames="M1;5,15,30,60H1;240H4;1440D1;10080W1;43200MN|0-CurrentTF";
extern string  MA_Method_Price="SMA0 EMA1 SMMA2 LWMA3||0O,1C 2H3L,4Md 5Tp 6WghC: Md(HL/2)4,Tp(HLC/3)5,Wgh(HLCC/4)6";


//+----

int init()
  {
   IndicatorBuffers(5);

   SetIndexStyle(0, DRAW_LINE);
   SetIndexStyle(1, DRAW_LINE);
   SetIndexStyle(2, DRAW_LINE);

//----
   SetIndexBuffer(0, RSI_Buffer);
   SetIndexBuffer(1, MA1_Buffer);
   SetIndexBuffer(2, MA2_Buffer);
   SetIndexBuffer(3, ExBuffer1);
   SetIndexBuffer(4, ExBuffer2);


   TimeFrame=MathMax(TimeFrame,Period());

   SetIndexShift(0,RSI_shift+ RSI_x_shift*TimeFrame/Period());
   SetIndexShift(1,MA1_shift+ MA1_x_shift*TimeFrame/Period());
   SetIndexShift(2,MA2_shift+ MA2_x_shift*TimeFrame/Period());

//----
   switch(TimeFrame)
   {
      case 1 : string   TimeFrameStr="M1";  break;
      case 5 :          TimeFrameStr="M5";  break;
      case 15 :         TimeFrameStr="M15"; break;
      case 30 :         TimeFrameStr="M30"; break;
      case 60 :         TimeFrameStr="H1";  break;
      case 240 :        TimeFrameStr="H4";  break;
      case 1440 :       TimeFrameStr="D1";  break;
      case 10080 :      TimeFrameStr="W1";  break;
      case 43200 :      TimeFrameStr="MN1"; break;
      default :         TimeFrameStr="TF0";
   }


   IndicatorShortName("RSI_2SigMA ("+RSI_Period+","+MA1_Period+","+MA2_Period+") ["+TimeFrameStr+"]");


   return(0);
  }

//+----

int deinit()
  {
//----
   return(0);
  }

//+----

int start()
  {
   datetime TimeArray[],TimeArray1[],TimeArray2[];

   int  limit,i,y=0,counted_bars = IndicatorCounted();

   if(counted_bars<0) return(-1);
   if(counted_bars>0) counted_bars--;

//----
    ArrayCopySeries(TimeArray, MODE_TIME,Symbol(),TimeFrame);
    ArrayCopySeries(TimeArray1,MODE_TIME,Symbol(),TimeFrame);
    ArrayCopySeries(TimeArray2,MODE_TIME,Symbol(),TimeFrame);

   limit = Bars - counted_bars;
   limit = MathMax(limit,TimeFrame/Period());

//----

   for(i=0,y=0;i<limit;i++)
    {
    if (Time[i]<TimeArray[y]) y++;

    RSI_Buffer[i] = iRSI(NULL, TimeFrame, RSI_Period, RSI_Price, y);
    ExBuffer1[y] = RSI_Buffer[i];
    }


   for(i=0,y=0;i<limit;i++)
    {
    if (Time[i]<TimeArray1[y]) y++;

    MA1_Buffer[i] = iMAOnArray(ExBuffer1,0,MA1_Period,0,MA1_Mode,y);
    ExBuffer2[y] = MA1_Buffer[i];
    }


   for(i=0,y=0;i<limit;i++)
    {
    if (Time[i]<TimeArray1[y]) y++;

    MA2_Buffer[i] = iMAOnArray(ExBuffer2,0,MA2_Period,0,MA2_Mode,y);
    }

   return(0);
}
//+---
Comments