SilverTrend_RonsSite
Download script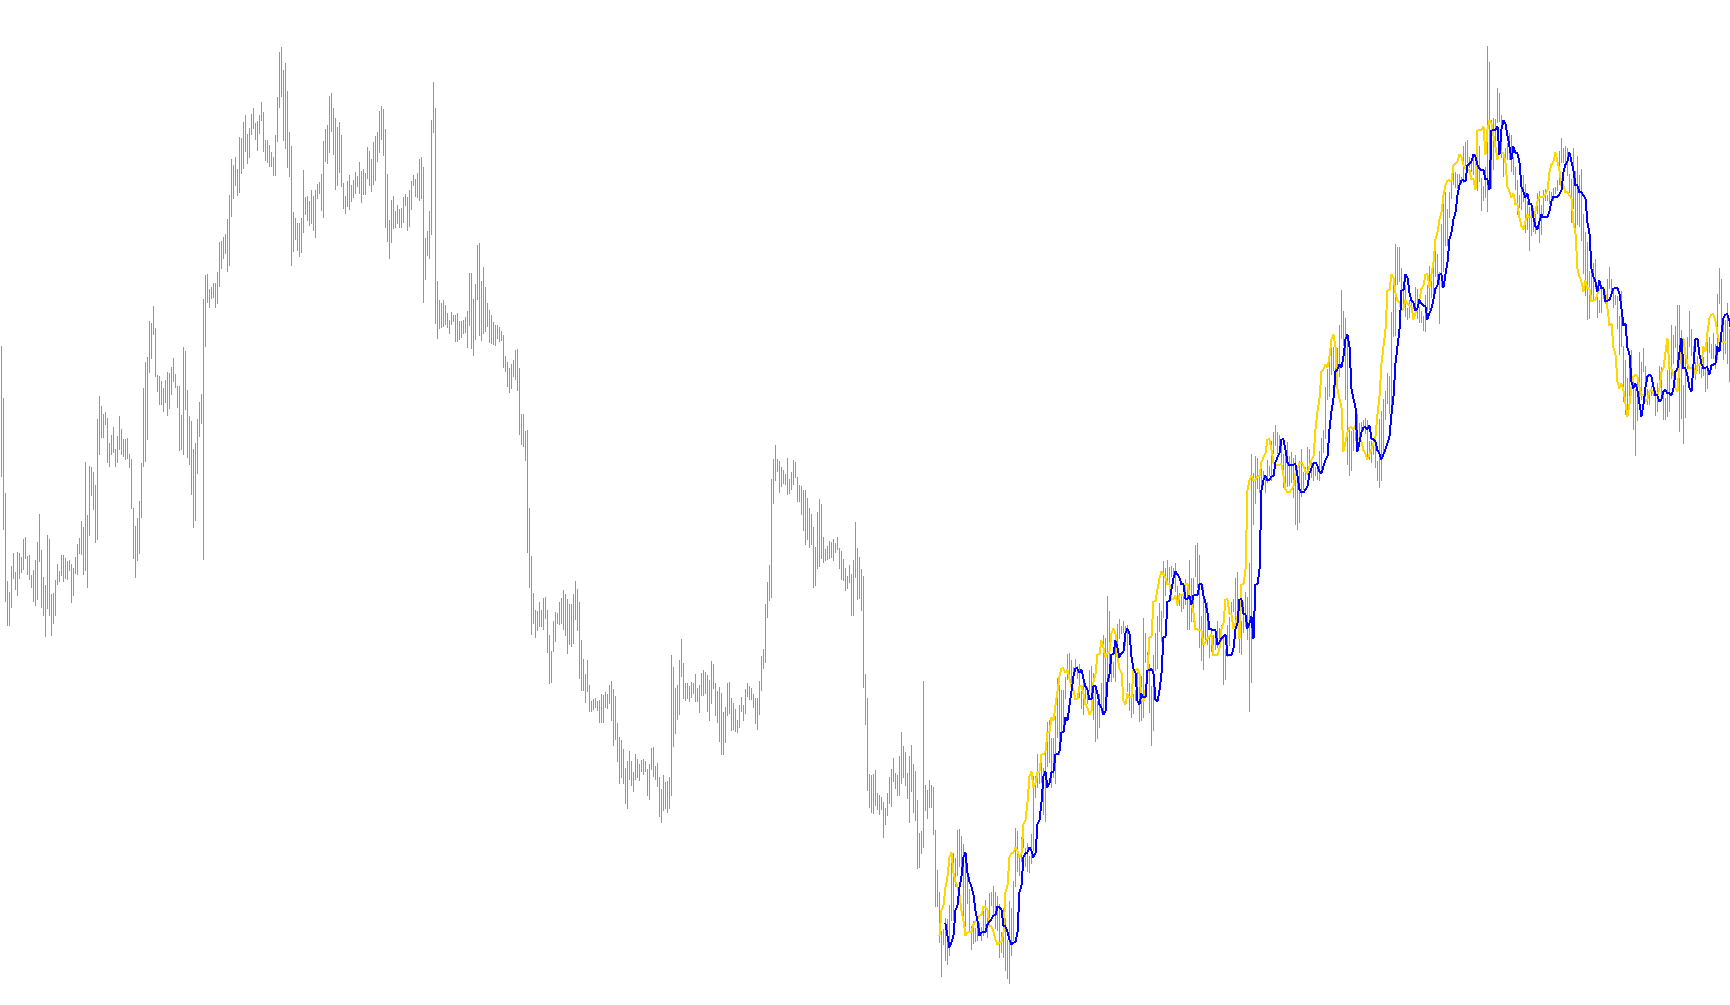
This technical tool is designed to identify potential price movement trends by analyzing historical price extremes and calculating specific threshold levels. Instead of looking at every minor price fluctuation, the logic focuses on identifying significant "highs" and "lows" within a rolling window of recent market activity.
Core Logic and Mechanism
The script operates by scanning the most recent market data to establish a range between the highest peak and the lowest trough. From this range, it calculates two distinct dynamic price levels:
- Upper Threshold (Resistance/Support): A calculated value based on the top of the recent price range.
- Lower Threshold (Support/Resistance): A calculated value based on the bottom of the recent price range.
These thresholds are adjusted using specific percentage-based multipliers, allowing the tool to project potential "zones" where the price might react or trend.
Visual Identification and Signals
The tool visualizes these calculations on your trading chart as two distinct lines (colored Blue and Red). By monitoring the relationship between these lines, the script determines the current market bias:
- Buy Indications: When the primary calculated value rises above a secondary reference point, the tool identifies a potential "Buy" trend. This is visually represented on the chart with a text comment and can trigger an audible sound or pop-up alert if enabled.
- Sell Indications: Conversely, when the primary value falls below the reference point, the tool identifies a potential "Sell" trend, updating the visual comments and triggering corresponding alerts.
Key Features for the User
- Trend Filtering: By focusing on specific bars (the "CountBars" parameter) and looking at highs/lows rather than every tick, the logic attempts to filter out market noise to highlight more significant movements.
- Automated Alerts: The system includes a notification bridge that ensures you are notified of trend shifts in real-time. It is programmed to be intelligent—meaning it won't spam multiple alerts for the same signal; it only notifies you when the trend direction actually switches from Buy to Sell or vice versa.
- Dynamic Updates: As new price data enters the chart, the calculations automatically refresh, ensuring the lines and signals move in synchronization with the live market.
//+------------------------------------------------------------------+
//|              Filename changed to ForexOFFTrend.mq4 by CrazyChart |
//|                                                 SilverTrend .mq4 |
//|                              SilverTrend rewritten by CrazyChart |
//|                                                  http://viac.ru/ |
//+------------------------------------------------------------------+

#property copyright "SilverTrend rewritten by CrazyChart"
#property link "http://viac.ru/ "
//----
#property indicator_chart_window
#property indicator_buffers 2
#property indicator_color1 Blue
#property indicator_color2 Red
//---- input parameters
extern int CountBars = 400;
extern int SSP = 3;
extern double Kmin = 1.6;
extern double Kmax = 50.6;
extern bool gAlert = false; // Switch to allow alerts
//---- buffers
double ExtMapBuffer1[];
double ExtMapBuffer2[];
//----
bool gSellAlertGiven = false; // Used to stop constant alerts
bool gBuyAlertGiven = false; // Used to stop constant alerts
//+------------------------------------------------------------------+
//| Custom indicator initialization function                         |
//+------------------------------------------------------------------+
int init()
  {
//---- indicators
   SetIndexStyle(0, DRAW_LINE, 0, 2);
   SetIndexBuffer(0, ExtMapBuffer1);
   SetIndexStyle(1, DRAW_LINE, 0, 2);
   SetIndexBuffer(1, ExtMapBuffer2);
//----
   if(CountBars >= Bars)
       CountBars = Bars;
   SetIndexDrawBegin(0, Bars - CountBars + SSP);
   SetIndexDrawBegin(1, Bars - CountBars + SSP);
//----
   return(0);
  }
//+------------------------------------------------------------------+
//| Custor indicator deinitialization function                       |
//+------------------------------------------------------------------+
int deinit()
  {
   return(0);
  }
//+------------------------------------------------------------------+
//| Custom indicator iteration function                              |
//+------------------------------------------------------------------+
int start()
  {
   int i,
   i2,
   loopbegin,
   counted_bars = IndicatorCounted();
   double SsMax,
   SsMin,
   K,
   val1,
   val2,
   smin,
   smax,
   price;
   if(Bars <= SSP + 1)
       return(0);
//---- initial zero
   if(counted_bars < SSP + 1)
     {
       for(i = 1; i <= SSP; i++)
           ExtMapBuffer1[CountBars-i] = 0.0;
       for(i = 1; i <= SSP; i++)
           ExtMapBuffer2[CountBars-i] = 0.0;
     }
   for(i = CountBars - SSP; i >= 0; i--)
     {
       SsMax = High[Highest(NULL, 0, MODE_HIGH, SSP, i - SSP + 1)];
       SsMin = Low[Lowest(NULL, 0, MODE_LOW, SSP, i - SSP + 1)];
       smin = NormalizeDouble((SsMin - (SsMax - SsMin)*Kmin / 100), Digits);
       smax = NormalizeDouble((SsMax - (SsMax - SsMin)*Kmax / 100), Digits);
       ExtMapBuffer1[i-SSP+6] = smax;
       ExtMapBuffer2[i-SSP-1] = smax;
       val1 = ExtMapBuffer1[0];
       val2 = ExtMapBuffer2[0];
       if(val1 > val2)
         {
           Comment(Symbol()+ " buy ", val1);
           if(gAlert == true && gBuyAlertGiven == false)
             {
               PlaySound("alert.wav");

               Alert(Symbol()+" Buy signal at " + DoubleToStr(val1, Digits) + " on " + Period() +
                     " minute chart");
               gBuyAlertGiven = true;
               gSellAlertGiven = false;
             }
         }
       if(val1 < val2)
         {
           Comment(Symbol()+ " sell ", val2);
           if(gAlert == true && gSellAlertGiven == false)
             {
               PlaySound("alert.wav");
               Alert(Symbol()+" Sell signal at " + DoubleToStr(val2, Digits) + " on " + Period()+
                     " minute chart");
               gBuyAlertGiven = false;
               gSellAlertGiven=true;
             }
         }
     }
//----
   return(0);
  }
//+------------------------------------------------------------------+
Comments