SmATR
Download script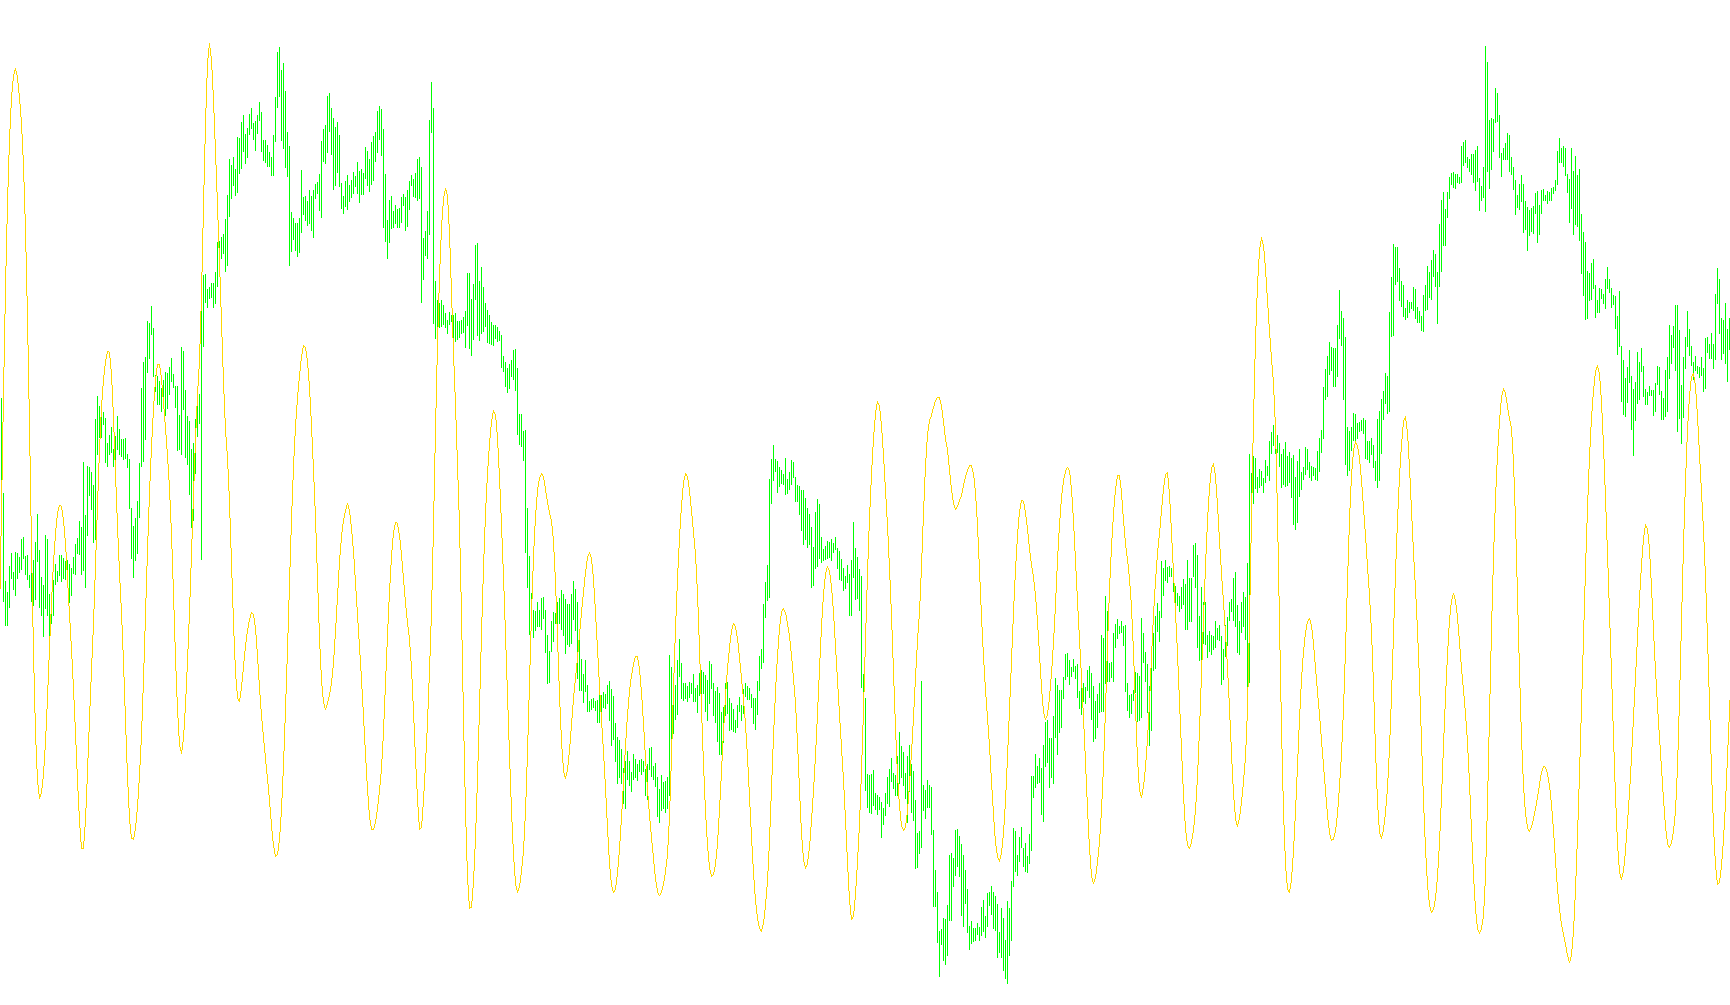
This tool is a specialized technical analysis indicator designed to provide a smoothed, high-clarity view of market volatility. By transforming raw price movement data into a refined visual signal, it helps traders distinguish between standard market "noise" and significant directional trends.
Core Logic and Methodology
The script operates through a multi-stage processing pipeline that progressively filters data to produce a stable output:
1. Volatility Measurement At the foundation level, the tool calculates the Average True Range (ATR). This represents the basic volatility of the market—essentially measuring how much the price is moving regardless of direction.
2. Recursive Smoothing (Triple Exponential Filtering) The core "intelligence" of this script lies in its multi-layered smoothing process. Instead of showing raw volatility, the tool passes the data through six successive stages of recursive averaging.
- Each stage takes a portion of the current data and blends it with the results of the previous calculation.
- By repeating this process six times, the script effectively "washes away" erratic price spikes and temporary fluctuations. This creates a much smoother curve that highlights the underlying momentum of the market's volatility.
3. Advanced Polynomial Weighting To further refine the output, the indicator applies a specific mathematical weighting system (using pre-calculated coefficients). This allows the tool to react more intelligently to trend changes rather than just lagging behind the price. It balances the sensitivity of the smoothed data so that it remains responsive enough to be useful while staying smooth enough to prevent false signals.
User Experience and Visual Output
- Visual Representation: The final result is displayed in a separate window below your main price chart as a golden line.
- Simplified Interpretation: Because the script performs the complex heavy lifting of multi-stage filtering and polynomial weighting internally, the user is presented with a clean, streamlined trend line.
- Purpose: This logic is ideal for traders looking to identify when market volatility is expanding or contracting in a sustained manner, providing a "cleaner" look at market dynamics than standard indicators might offer.
//+------------------------------------------------------------------+
//|                                                        SmATR.mq4 |
//|                                                       MetaQuotes |
//|                 http://forum.alpari-idc.ru/viewtopic.php?t=48186 |
//+------------------------------------------------------------------+
#property copyright "MetaQuotes"
#property link      "http://forum.alpari-idc.ru/viewtopic.php?t=48186"

#property indicator_separate_window
#property indicator_buffers 1
#property indicator_color1 Gold

//---- input parameters
extern double    t3_period=8.0;
extern int       AtrPeriod=14;
extern double    b=0.7;

//---- buffers
double ExtMapBuffer1[];

double e1Buffer[];
double e2Buffer[];
double e3Buffer[];
double e4Buffer[];
double e5Buffer[];
double e6Buffer[];

double /*e1,e2,e3,e4,e5,e6,*/c1,c2,c3,c4,n,w1,w2,b2,b3;
double dpo,t3,ATR;

//+------------------------------------------------------------------+
//| Custom indicator initialization function                         |
//+------------------------------------------------------------------+
int init()
  {
     string short_name;
//---- indicators
   IndicatorBuffers(8);

   SetIndexStyle(0,DRAW_LINE);
   SetIndexBuffer(0,ExtMapBuffer1);

   SetIndexBuffer(2,e1Buffer);
   SetIndexBuffer(3,e2Buffer);
   SetIndexBuffer(4,e3Buffer);
   SetIndexBuffer(5,e4Buffer);
   SetIndexBuffer(6,e5Buffer);
   SetIndexBuffer(7,e6Buffer);

   SetIndexEmptyValue(0,0.0);
   SetIndexEmptyValue(1,0.0);
   SetIndexEmptyValue(2,0.0);
   SetIndexEmptyValue(3,0.0);
   SetIndexEmptyValue(4,0.0);
   SetIndexEmptyValue(5,0.0);
   SetIndexEmptyValue(6,0.0);
   SetIndexEmptyValue(7,0.0);

   //---- name for DataWindow and indicator subwindow label
   short_name="SmATR("+AtrPeriod+")";
   IndicatorShortName(short_name);
   SetIndexLabel(0,short_name);

   //----
   b2=b*b;
   b3=b2*b;
   c1=-b3;
   c2=(3*(b2+b3));
   c3=-3*(2*b2+b+b3);
   c4=(1+3*b+b3+3*b2);
   n=t3_period;

   if(n<1) n=1;
   n = 1 + 0.5*(n-1);
   w1 = 2 / (n + 1);
   w2 = 1 - w1;

//----
   return(0);
  }
//+------------------------------------------------------------------+
//| Custom indicator deinitialization function                       |
//+------------------------------------------------------------------+
int deinit()
  {
//----

//----
   return(0);
  }
//+------------------------------------------------------------------+
//| Custom indicator iteration function                              |
//+------------------------------------------------------------------+
int start()
  {
   int    counted_bars=IndicatorCounted();
   int shift,limit;
   if (counted_bars==0) limit=Bars-AtrPeriod;
   if (counted_bars>=0) limit=Bars-counted_bars;
   limit--;

   for (shift=limit;shift>=0;shift--)
      {//Begin

      ATR=iATR(NULL,0,AtrPeriod,shift);
      dpo=ATR;
      e1Buffer[shift] = w1*dpo + w2*e1Buffer[shift+1];
      e2Buffer[shift] = w1*e1Buffer[shift] + w2*e2Buffer[shift+1];
      e3Buffer[shift] = w1*e2Buffer[shift] + w2*e3Buffer[shift+1];
      e4Buffer[shift] = w1*e3Buffer[shift] + w2*e4Buffer[shift+1];
      e5Buffer[shift] = w1*e4Buffer[shift] + w2*e5Buffer[shift+1];
      e6Buffer[shift] = w1*e5Buffer[shift] + w2*e6Buffer[shift+1];

      t3 = c1*e6Buffer[shift] + c2*e5Buffer[shift] + c3*e4Buffer[shift] + c4*e3Buffer[shift];

      if (t3==0) t3=0.0001;

      ExtMapBuffer1[shift]=t3;
   }
   return(0);
  }
//+------------------------------------------------------------------+
Comments