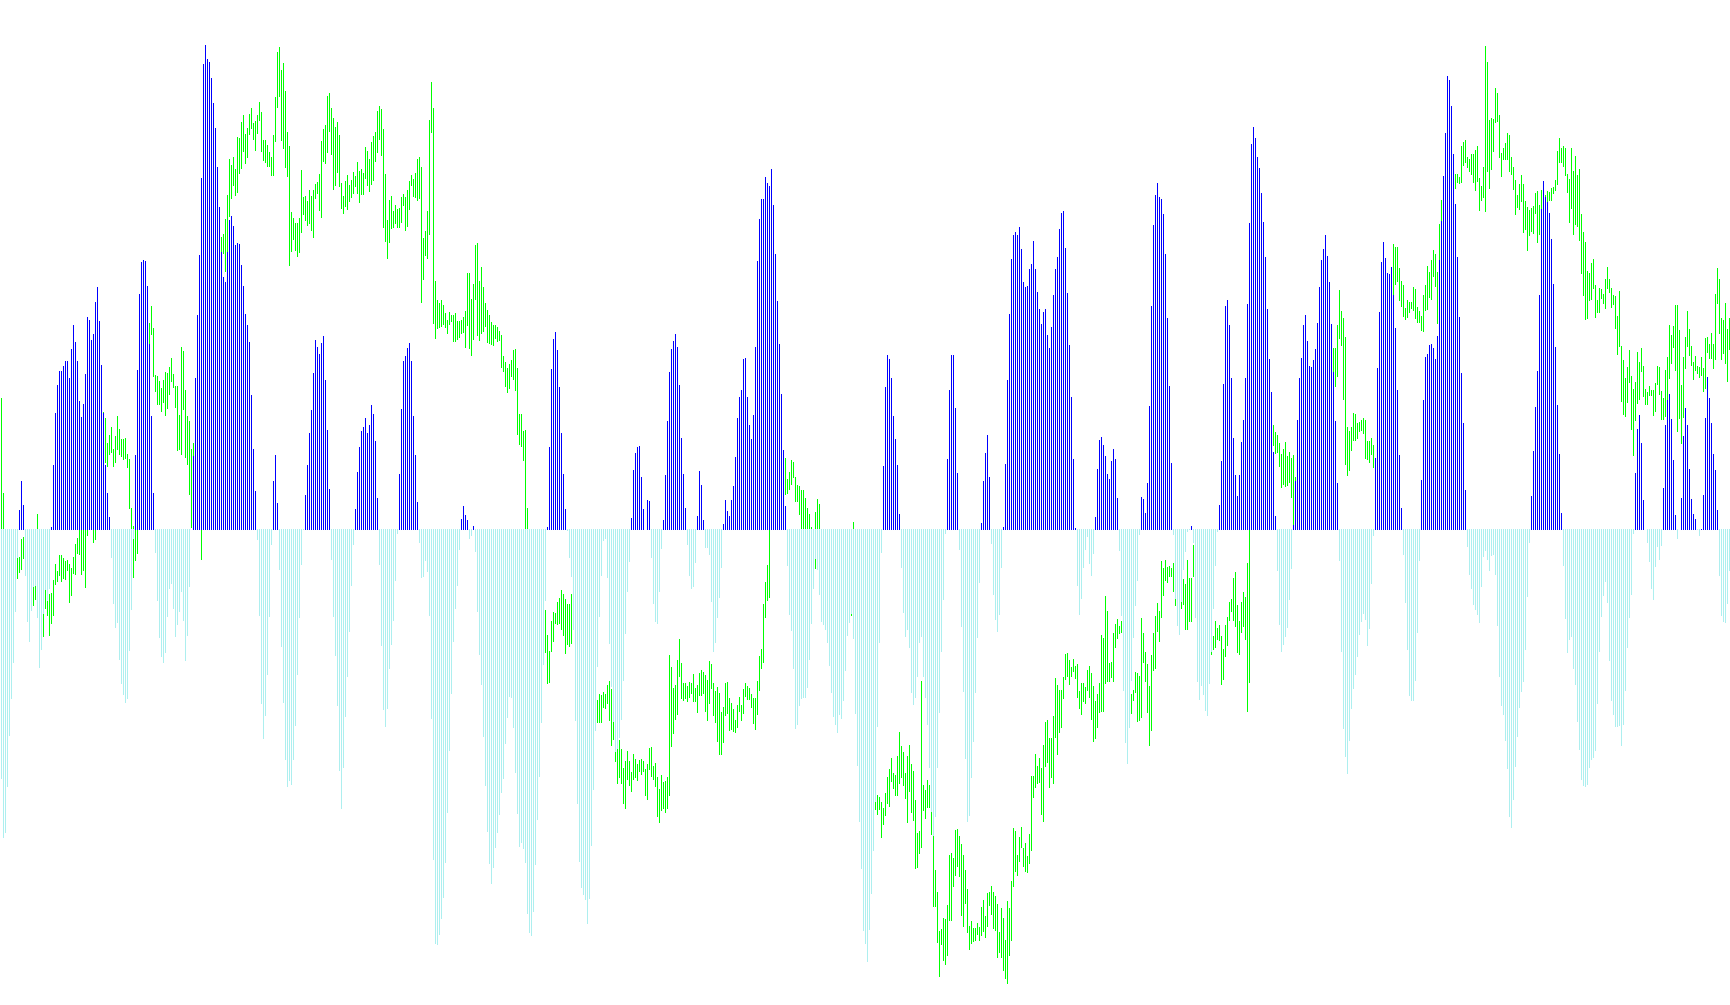
This tool is designed to help traders visualize momentum and price movement by analyzing the relative position of market prices within a specific timeframe. Instead of looking at raw price points, it focuses on where the current price sits between the highest highs and lowest lows over a set number of candles (the "period").
Core Logic Overview
The script operates through a multi-step calculation process to filter out market noise and identify clear trends:
1. Relative Positioning The system first identifies the highest peak and the lowest valley over the chosen timeframe. It then determines where the current price is located relative to those two points. This creates a normalized value, essentially asking: "Is the price currently leaning toward the top of the range, the bottom, or sitting in the middle?"
2. Smoothing and Weighting To prevent the indicator from reacting too wildly to every tiny tick in the market, the script applies a weighted calculation. It blends the new relative position with the previous data point. This "memory" allows the indicator to move more fluidly, ensuring that small, insignificant fluctuations don't cause erratic jumps on the chart.
3. Logarithmic Scaling The script translates these relative positions into a mathematical curve using a logarithmic formula. This helps in making the visual movements of the indicator more proportional and easier for a human to read, highlighting the intensity of the momentum.
4. Trend Filtering (The Visual Output) Finally, the logic categorizes the resulting data into two distinct signals:
- Bullish Momentum: When the calculated value trends upward or stays above a specific threshold, it is highlighted in one color (Lime). This indicates that the price strength is leaning toward the upper range.
- Bearish Momentum: When the value turns downward or falls below the threshold, it shifts to another color (Red), indicating that price strength is leaning toward the lower range.
How to Interpret the Results
The final output is a dual-colored histogram. By looking at the colors, you can quickly see which direction the current momentum is favoring. When the display switches from one color to another, it signifies a shift in the market's "weight"—moving from a state where the price was favoring the highs to a state where it is favoring the lows, or vice versa.
#property  copyright "Copyright © 2005, Yura Prokofiev"
#property  link      "Yura.prokofiev@gmail.com"

#property  indicator_separate_window
#property  indicator_buffers 3
#property  indicator_color2  Lime
#property  indicator_color3  Red
#property indicator_style2 STYLE_SOLID
#property indicator_style3 STYLE_SOLID
#property indicator_width2 3
#property indicator_width3 3
extern int period=10;

double         ExtBuffer0[];
double         ExtBuffer1[];
double         ExtBuffer2[];


int init()
  {

   SetIndexStyle(0,DRAW_NONE);
   SetIndexStyle(1,DRAW_HISTOGRAM);
   SetIndexStyle(2,DRAW_HISTOGRAM);
   IndicatorDigits(Digits+1);

   SetIndexBuffer(0,ExtBuffer0);
   SetIndexBuffer(1,ExtBuffer1);
   SetIndexBuffer(2,ExtBuffer2);

   IndicatorShortName("Fisher_Yur4ik");
   SetIndexLabel(1,NULL);
   SetIndexLabel(2,NULL);

   return(0);
  }


int start()
  {
   //int     period=10;
   int    limit;
   int    counted_bars=IndicatorCounted();
   double prev,current,old;
   double Value=0,Value1=0,Value2=0,Fish=0,Fish1=0,Fish2=0;
   double price;
   double MinL=0;
   double MaxH=0;


   if(counted_bars>0) counted_bars--;
   limit=Bars-counted_bars;


   for(int i=0; i<Bars; i++)
    {
      MaxH = High[Highest(NULL,0,MODE_HIGH,period,i)];
      MinL = Low[Lowest(NULL,0,MODE_LOW,period,i)];
      price = (High[i]+Low[i])/2;

      if(MaxH-MinL == 0) Value = 0.33*2*(0-0.5) + 0.67*Value1;
      else Value = 0.33*2*((price-MinL)/(MaxH-MinL)-0.5) + 0.67*Value1;

      Value=MathMin(MathMax(Value,-0.999),0.999);

      if(1-Value == 0) ExtBuffer0[i]=0.5+0.5*Fish1;
      else ExtBuffer0[i]=0.5*MathLog((1+Value)/(1-Value))+0.5*Fish1;

      Value1=Value;
      Fish1=ExtBuffer0[i];
    }


   bool up=true;
   for(i=Bars; i>=0; i--)
     {
      current=ExtBuffer0[i];
      prev=ExtBuffer0[i+1];

      if (((current<0)&&(prev>0))||(current<0))   up= false;
      if (((current>0)&&(prev<0))||(current>0))   up= true;

      if(!up)
        {
         ExtBuffer2[i]=current;
         ExtBuffer1[i]=0.0;
        }

       else
         {
          ExtBuffer1[i]=current;
          ExtBuffer2[i]=0.0;
         }
     }

   return(0);
  }
Comments