Synergy_APB
Download script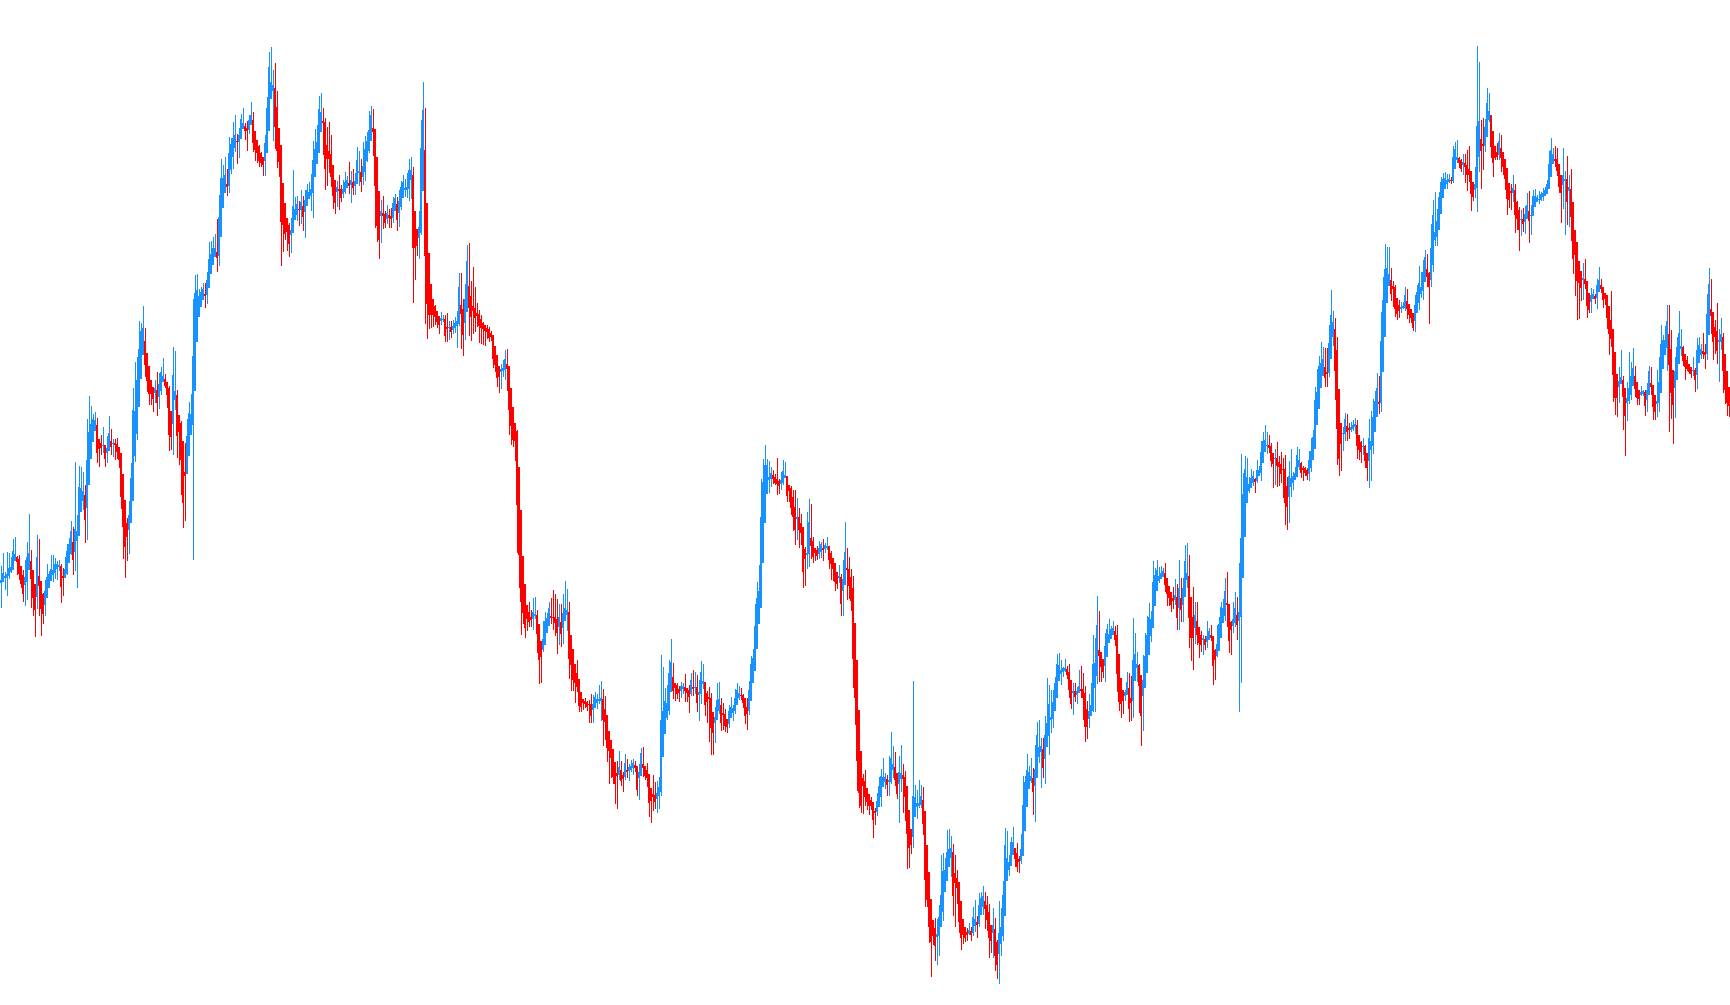
This tool is designed for the MetaTrader trading platform to provide a visual representation of price action trends on your charts. It functions by analyzing historical price data to identify specific price levels, which are then displayed as color-coded histograms.
Core Functionality
The script processes every price bar on your chart to calculate two distinct types of "average" values. By comparing these values, the tool determines the direction of the market flow:
- Primary Price Averaging: The logic begins by taking the four standard price points (Open, High, Low, and Close) of a candle to find a central mean. It then combines this with the Closing price to create a refined average.
- Comparative Analysis: Simultaneously, the tool looks at the previous candle's calculated averages to establish a baseline for comparison.
Visual Logic & Market Signals
The script uses these calculations to "color" the price action on your screen. It identifies whether the current market movement is bullish or bearish based on the following logic:
- Upward Movement (Dodger Blue): If the calculated averages suggest that the price trend is moving higher, the tool highlights these levels in blue. This helps traders visually identify strength and upward momentum.
- Downward Movement (Red): If the averages indicate a declining trend, the tool highlights the data in red, signaling downward pressure or bearish sentiment.
How it appears on your Chart
Instead of just showing simple lines, this script renders four distinct data buffers as histograms. This allows you to see:
- The calculated "High" and "Low" boundaries of the current trend.
- The specific "Open" and "Close" average levels used to derive those boundaries.
By providing this visual distinction between red and blue zones, the indicator simplifies the complexity of raw price movements, allowing you to see the underlying "synergy" of the price averages at a glance.
/*
   Generated by EX4-TO-MQ4 decompiler V4.0.224.1 []
   Website: http://purebeam.biz
   E-mail : purebeam@gmail.com
*/
#property copyright "Copyright © 2009, CompassFX"
#property link      "http://www.compassfx.com"

#property indicator_chart_window
#property indicator_buffers 4
#property indicator_color1 Red
#property indicator_color2 DodgerBlue
#property indicator_color3 Red
#property indicator_color4 DodgerBlue

extern string Custom_Indicator = "Synergy Average Price Bars";
extern string Copyright = "© 2009, CompassFX";
extern string Web_Address = "www.compassfx.com";
double g_ibuf_100[];
double g_ibuf_104[];
double g_ibuf_108[];
double g_ibuf_112[];
int gi_116 = 0;

int init() {
   SetIndexStyle(0, DRAW_HISTOGRAM, STYLE_SOLID, 1, Red);
   SetIndexBuffer(0, g_ibuf_100);
   SetIndexLabel(0, "HA_0");
   SetIndexStyle(1, DRAW_HISTOGRAM, STYLE_SOLID, 1, DodgerBlue);
   SetIndexBuffer(1, g_ibuf_104);
   SetIndexLabel(1, "HA_1");
   SetIndexStyle(2, DRAW_HISTOGRAM, STYLE_SOLID, 3, Red);
   SetIndexBuffer(2, g_ibuf_108);
   SetIndexLabel(2, "HA_Open");
   SetIndexStyle(3, DRAW_HISTOGRAM, STYLE_SOLID, 3, DodgerBlue);
   SetIndexBuffer(3, g_ibuf_112);
   SetIndexLabel(3, "HA_Close");
   SetIndexDrawBegin(0, 10);
   SetIndexDrawBegin(1, 10);
   SetIndexDrawBegin(2, 10);
   SetIndexDrawBegin(3, 10);
   SetIndexBuffer(0, g_ibuf_100);
   SetIndexBuffer(1, g_ibuf_104);
   SetIndexBuffer(2, g_ibuf_108);
   SetIndexBuffer(3, g_ibuf_112);
   return (0);
}

int deinit() {
   return (0);
}

int start() {
   double ld_0;
   double ld_8;
   double ld_16;
   double ld_24;
   if (Bars <= 10) return (0);
   gi_116 = IndicatorCounted();
   if (gi_116 < 0) return (-1);
   if (gi_116 > 0) gi_116--;
   for (int li_32 = Bars - gi_116 - 1; li_32 >= 0; li_32--) {
      ld_24 = NormalizeDouble((Open[li_32] + High[li_32] + Low[li_32] + Close[li_32]) / 4.0, Digits);
      ld_24 = (ld_24 + Close[li_32]) / 2.0;
      ld_0 = (g_ibuf_108[li_32 + 1] + (g_ibuf_112[li_32 + 1])) / 2.0;
      ld_8 = MathMax(High[li_32], MathMax(ld_0, ld_24));
      ld_16 = MathMin(Low[li_32], MathMin(ld_0, ld_24));
      if (ld_0 < ld_24) {
         g_ibuf_100[li_32] = ld_16;
         g_ibuf_104[li_32] = ld_8;
      } else {
         g_ibuf_100[li_32] = ld_8;
         g_ibuf_104[li_32] = ld_16;
      }
      g_ibuf_108[li_32] = ld_0;
      g_ibuf_112[li_32] = ld_24;
   }
   return (0);
}
Comments