Trendstrength
Download script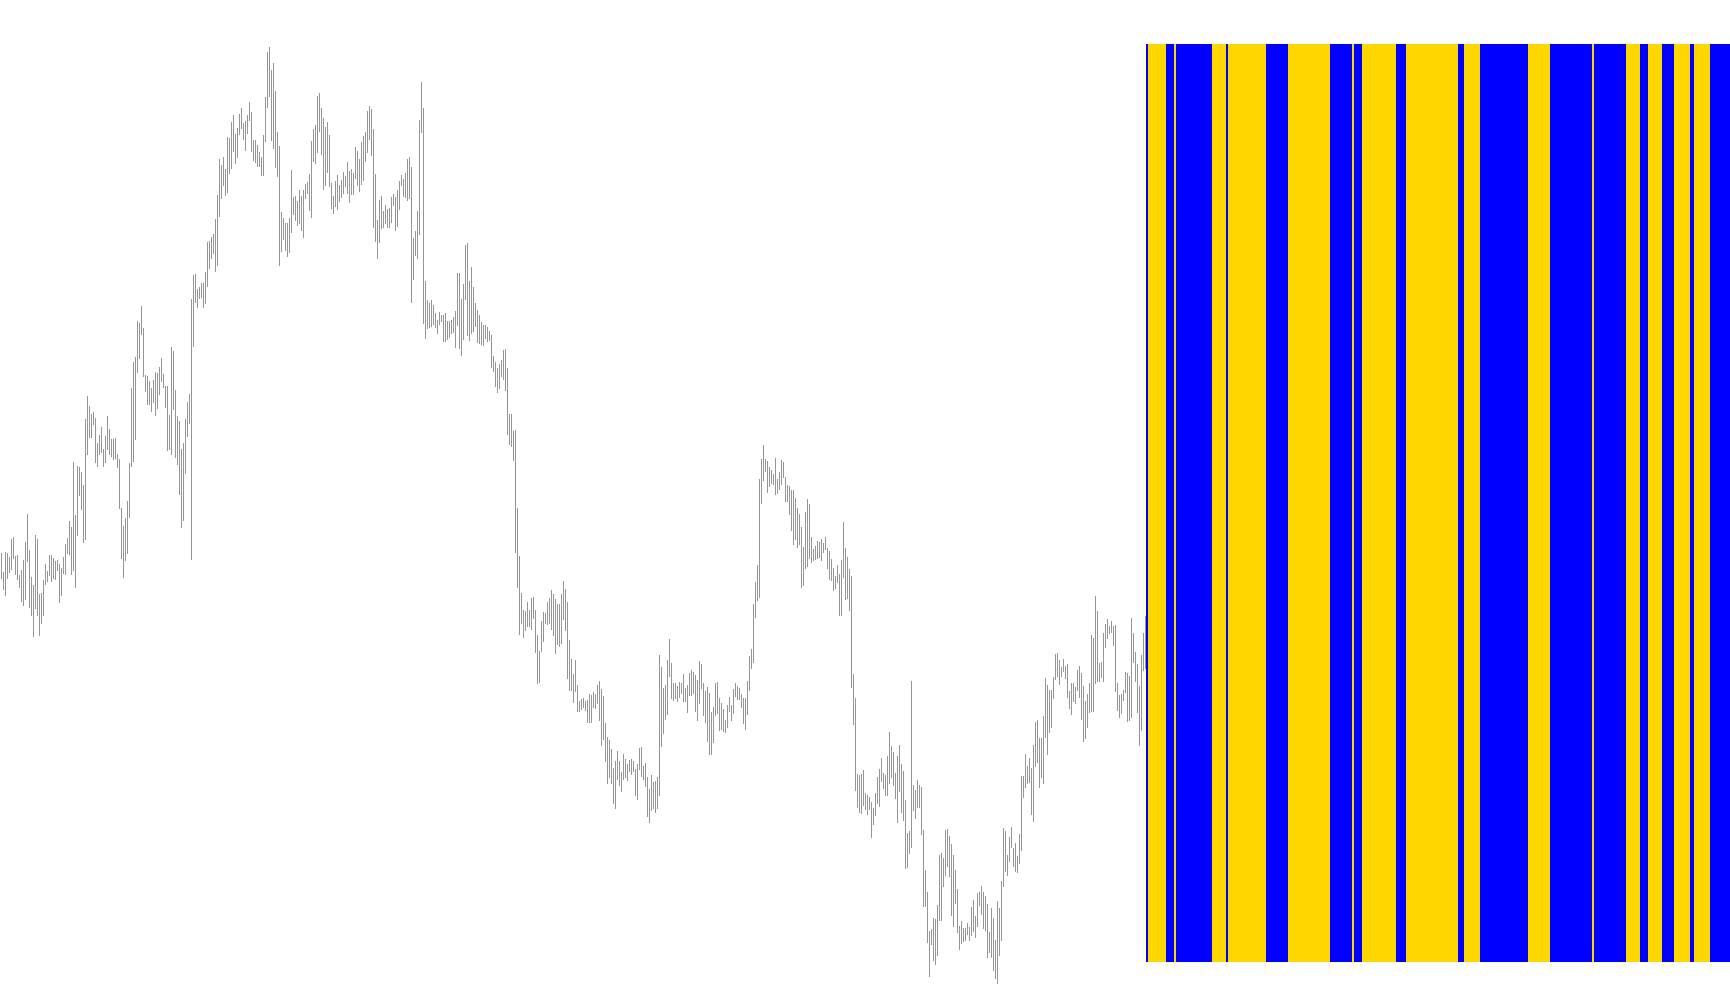
This tool is designed to provide traders with a visual representation of price momentum and trend direction by analyzing historical price extremes. Rather than reacting to every minor fluctuation, the script focuses on specific "highs" and "lows" over a defined period to identify potential support and resistance levels.
How the Logic Works
1. Price Range Analysis The script looks back at a fixed window of recent candles (specifically 7 bars) to identify the highest price reached and the lowest price recorded within that timeframe. By looking at this "range," the tool establishes the boundaries of current market volatility.
2. Dynamic Level Calculation Once the high and low points are identified, the script calculates a specific percentage-based threshold (set at 50.6%). It uses this percentage to determine a mid-point value between the recent peak and the trough. This calculation essentially identifies a "pivot point" or a "fair value" zone within that specific price window.
3. Trend Direction Detection The core logic compares these calculated values across consecutive periods. By monitoring whether the current calculated value is rising or falling relative to the previous period, the script determines the underlying momentum of the market.
4. Visual Representation The results are displayed in a separate window as a histogram:
- When the calculated momentum indicates an upward bias, the indicator triggers a specific visual state (DeepSkyBlue).
- When the momentum shifts downward, the indicator switches to its opposite state (Red).
Summary for the Trader
Essentially, this script acts as a trend-following filter. It smooths out market noise by ignoring minor price wiggles and instead highlights the broader movement of the market based on where prices are trading relative to recent highs and lows. It allows you to see at a glance whether the current "weight" of the price action is pushing toward the upper bound or the lower bound of its recent range.
#property indicator_separate_window
#property indicator_buffers 2
#property indicator_color1 DeepSkyBlue
#property indicator_color2 Red

int gi_76 = 7;
double gd_80 = 50.6;
int g_bars_88 = 300;
double g_ibuf_92[];
double g_ibuf_96[];
double g_ibuf_100[];
double g_ibuf_104[];

int init() {
   IndicatorBuffers(4);
   SetIndexStyle(0, DRAW_HISTOGRAM, STYLE_SOLID, 4);
   SetIndexBuffer(0, g_ibuf_100);
   SetIndexStyle(1, DRAW_HISTOGRAM, STYLE_SOLID, 4);
   SetIndexBuffer(1, g_ibuf_104);
   SetIndexBuffer(2, g_ibuf_92);
   SetIndexBuffer(3, g_ibuf_96);
   IndicatorShortName("dpt9(" + gi_76 + ")");
   return (0);
}

int deinit() {
   return (0);
}

int start() {
   double ld_8;
   double ld_16;
   double ld_32;
   if (g_bars_88 >= Bars) g_bars_88 = Bars;
   SetIndexDrawBegin(0, Bars - g_bars_88 + gi_76);
   SetIndexDrawBegin(1, Bars - g_bars_88 + gi_76);
   int l_ind_counted_4 = IndicatorCounted();
   if (Bars <= gi_76 + 1) return (0);
   if (l_ind_counted_4 < gi_76 + 1) {
      for (int li_0 = 1; li_0 <= gi_76; li_0++) g_ibuf_92[g_bars_88 - li_0] = 0.0;
      for (li_0 = 1; li_0 <= gi_76; li_0++) g_ibuf_96[g_bars_88 - li_0] = 0.0;
   }
   for (li_0 = g_bars_88 - gi_76; li_0 >= 0; li_0--) {
      ld_8 = High[iHighest(NULL, 0, MODE_HIGH, gi_76, li_0 - gi_76 + 1)];
      ld_16 = Low[iLowest(NULL, 0, MODE_LOW, gi_76, li_0 - gi_76 + 1)];
      ld_32 = ld_8 - (ld_8 - ld_16) * gd_80 / 100.0;
      g_ibuf_92[li_0 - gi_76 + 6] = ld_32;
      g_ibuf_96[li_0 - gi_76 - 1] = ld_32;
   }
   for (int li_40 = g_bars_88 - gi_76; li_40 >= 0; li_40--) {
      if (g_ibuf_92[li_40] > g_ibuf_96[li_40]) {
         g_ibuf_100[li_40] = 1;
         g_ibuf_104[li_40] = 0;
      } else {
         g_ibuf_100[li_40] = 0;
         g_ibuf_104[li_40] = 1;
      }
   }
   return (0);
}
Comments