TradePrice-T03
Download script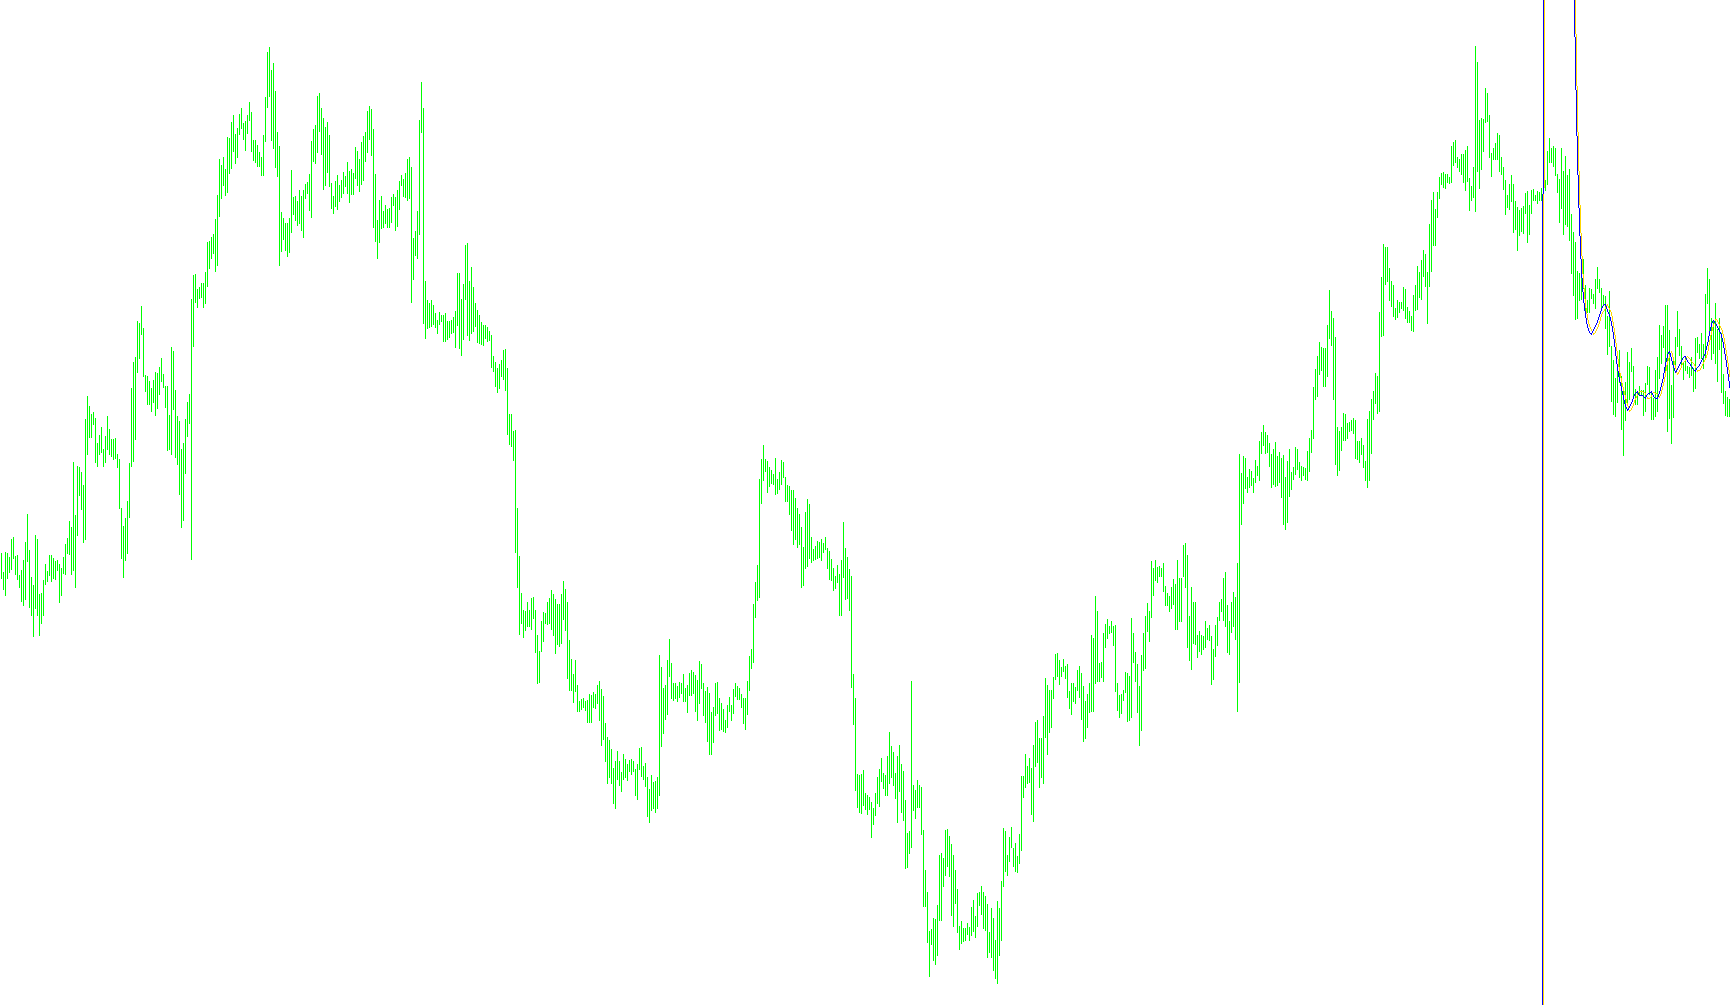
This script is designed as a technical analysis indicator for the MetaTrader platform. Its primary purpose is to track and visualize price movements by creating two distinct, reactive boundary lines that respond to high and low price fluctuations.
Core Logic Overview
The script operates by analyzing historical price data (specifically the highest and lowest points reached during each time period) to calculate a smoothed trend. Rather than simply following the raw price, which can be volatile and "noisy," this tool uses a mathematical smoothing process to identify underlying momentum.
How it Works
1. Data Smoothing and Weighting The script utilizes a specific weighting system (based on user-defined periods) to determine how much importance to give to recent price action versus older data. This ensures that the resulting lines move fluidly across the chart, filtering out minor market jitters while still reacting to significant trends.
2. Dual Boundary Calculation The logic treats the "High" and "Low" prices as two separate streams of information:
- Upper Boundary: Calculated using the high points of the price bars.
- Lower Boundary: Calculated using the low points of the price bars.
By applying a specific mathematical formula to these highs and lows, the script generates two lines that represent the "ceiling" and "floor" of the current market movement.
3. Dynamic Interaction (The Convergence Logic) A unique feature of this script is how the two lines interact with one another. The logic includes a "correction" mechanism:
- If the lower boundary moves too close to or exceeds the upper boundary, the script applies a small adjustment (a "delay" or "delta") to push them apart slightly.
- This prevents the two lines from merging into a single point during periods of very low volatility, ensuring that the indicator maintains its visual clarity and continues to provide a readable gap between the two price boundaries.
Summary for the User
Essentially, this tool acts as a "smoothed corridor" for market price. It helps traders visualize the range in which the price is currently trading. By looking at the space between the Gold (upper) and Red (lower) lines, users can better perceive the dynamic range of the market, identifying when the price is pushing against its boundaries or moving within a stable channel.
//+------------------------------------------------------------------+
//|                                    TradePrice-T03.mq4            |
//|                                                                  |
//|                                    Converted by Mql2Mq4 v0.7     |
//|                                    http://yousky.free.fr         |
//|                                    Copyright © 2006, Yousky Soft |
//+------------------------------------------------------------------+
#include <stdlib.mqh>
//----
#property copyright " Copyright © 2006, HomeSoft Corp."
#property link      " spiky@sinet.spb.ru"
//----
#property indicator_chart_window
#property indicator_color1 Gold
#property indicator_buffers 2
#property indicator_color2 Red
//+------------------------------------------------------------------+
//| External variables                                               |
//+------------------------------------------------------------------+
extern double t3_period=21;
extern double b=0.7;
extern double mBar=100;
extern double del=0.0001;
extern double smr=0;
extern double smg=0;
//+------------------------------------------------------------------+
//| Special Convertion Functions                                     |
//+------------------------------------------------------------------+
int LastTradeTime;
double ExtHistoBuffer[];
double ExtHistoBuffer2[];
//+------------------------------------------------------------------+
//|                                                                  |
//+------------------------------------------------------------------+
void SetLoopCount(int loops)
  {
  }
//+------------------------------------------------------------------+
//|                                                                  |
//+------------------------------------------------------------------+
void SetIndexValue(int shift, double value)
  {
   ExtHistoBuffer[shift]=value;
  }
//+------------------------------------------------------------------+
//|                                                                  |
//+------------------------------------------------------------------+
void SetIndexValue2(int shift, double value)
  {
   ExtHistoBuffer2[shift]=value;
  }
//+------------------------------------------------------------------+
//| Initialization                                                   |
//+------------------------------------------------------------------+
int init()
  {
   SetIndexStyle(0, DRAW_LINE, STYLE_SOLID);
   SetIndexBuffer(0, ExtHistoBuffer);
   SetIndexStyle(1, DRAW_LINE, STYLE_SOLID);
   SetIndexBuffer(1, ExtHistoBuffer2);
   return(0);
  }
//+------------------------------------------------------------------+
//|                                                                  |
//+------------------------------------------------------------------+
int start()
  {
   //+------------------------------------------------------------------+
   //| Local variables                                                  |
   //+------------------------------------------------------------------+
   double e1=0;
   double e2=0;
   double e3=0;
   double e4=0;
   double e5=0;
   double e6=0;
   double c1=0;
   double c2=0;
   double c3=0;
   double c4=0;
   double n=0;
   double w1=0;
   double w2=0;
   double b2=0;
   double b3=0;
   double dpoh=0;
   double th3=0;
   double tl3=0;
   int shift=0;
   double dpol=0;
   bool ft=true;
     if(ft)
     {
      b2=b*b;
      b3=b2*b;
      c1=-b3;
      c2=(3*(b2+b3));
      c3=-3*(2*b2+b+b3);
      c4=(1+3*b+b3+3*b2);
      n=t3_period;
//----
      if(n<1)n=1;
      n=1 + 0.5*(n-1);
      w1=2/(n + 1);
     w2=1 - w1;ft=false;}
//----
   SetLoopCount(0);
   // loop from first bar to current bar (with shift=0)
   for(shift=Bars-1;shift>=0 ;shift--)
   {
    SetIndexValue(shift, 0); SetIndexValue2(shift, 0);
   }
     for(shift=mBar;shift>=0 ;shift--)
     {
      dpoh=High[shift];
//----
      e1=w1*dpoh + w2*e1;
      e2=w1*e1 + w2*e2;
      e3=w1*e2 + w2*e3;
      e4=w1*e3 + w2*e4;
      e5=w1*e4 + w2*e5;
      e6=w1*e5 + w2*e6;
      th3=c1*e6 + c2*e5 + c3*e4 + c4*e3;
      dpol=Low[shift];
//----
      e1=w1*dpol + w2*e1;
      e2=w1*e1 + w2*e2;
      e3=w1*e2 + w2*e3;
      e4=w1*e3 + w2*e4;
      e5=w1*e4 + w2*e5;
      e6=w1*e5 + w2*e6;
      tl3=c1*e6 + c2*e5 + c3*e4 + c4*e3;
//----
      if(tl3>th3)th3=th3-del;
      if(th3>tl3)tl3=tl3-del;
      SetIndexValue(shift+smg,th3); SetIndexValue2(shift+smr,tl3);
     }
   return(0);
  }
//+------------------------------------------------------------------+
Comments