TradeSig_v6
Download script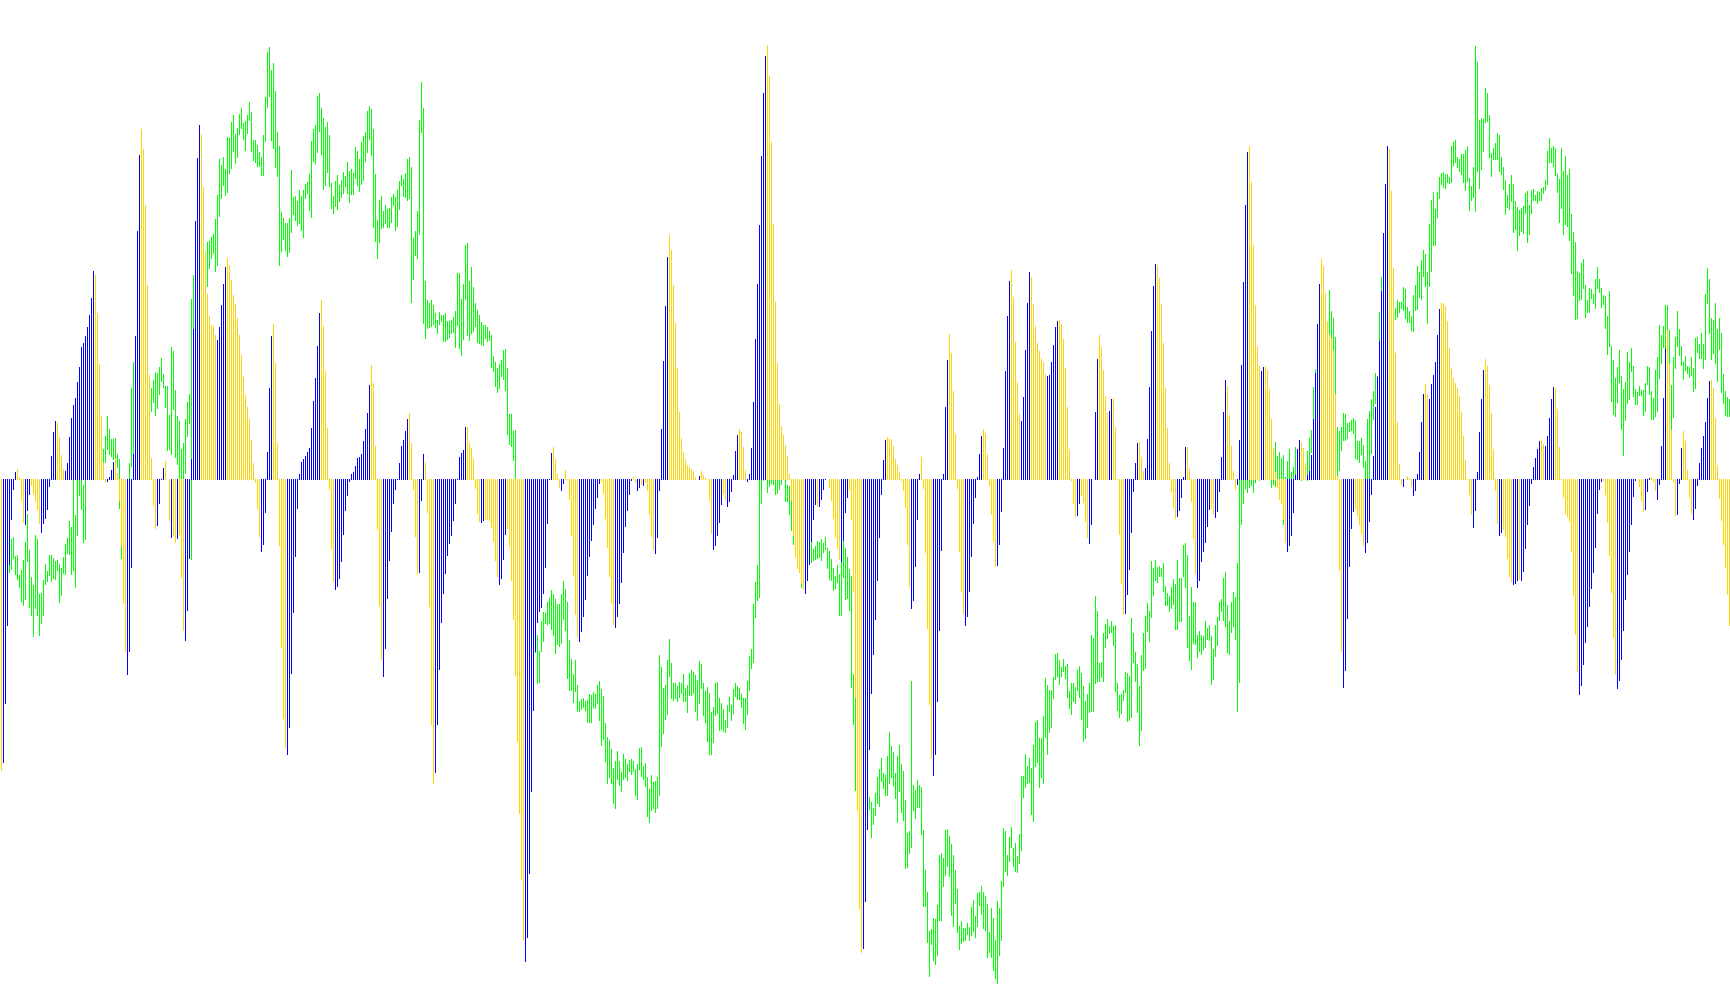
This tool is designed as a visual market analyzer for MetaTrader, specifically created to help traders identify momentum shifts and trend reversals by filtering out market "noise." Unlike standard indicators that might react too quickly to minor price fluctuations, this script uses a sophisticated smoothing technique to highlight significant movements.
Core Operational Logic
The logic operates through several distinct layers of processing:
1. Data Smoothing (Exponential Moving Averages) The script begins by calculating two different sets of Exponential Moving Averages (EMAs). By using EMAs, the tool prioritizes recent price action while still maintaining a connection to historical trends. It looks at specific "points" in time—calculating differences between current averages and those from several bars back—to determine the raw momentum of the market.
2. Signal Difference Calculation Once the initial averages are established, the script calculates the numerical difference (the "gap") between these moving averages. This allows the tool to quantify how fast the price is accelerating or decelerating in a specific direction.
3. Advanced Filtering (The Multi-Stage Smoothing) This is the most critical part of the logic. Instead of showing the raw momentum differences immediately, the script passes the data through a multi-stage filtering process. It applies a series of weighted calculations to "clean" the data. By doing this multiple times, the tool rounds off erratic spikes and sharp zig-zags, ensuring that only sustained, meaningful price movements are displayed on your chart.
4. Dynamic Comparison and Visualization
Finally, the script compares two different smoothed signals (represented in the code as t3 and t2).
- When one signal becomes stronger than the other, the tool identifies a potential trend direction.
- The results are displayed as a histogram in a separate window.
- The logic is designed to show "peaks" or "valleys" where the momentum shifts, changing colors (Red and Lime) to provide a clear visual cue of whether the current price energy is moving upward or downward.
Summary for the User
Essentially, this script acts as a momentum stabilizer. It looks at the speed of price changes, smooths out the "jitter" of the market, and provides a clean, two-toned visual representation of where the market's true strength is heading. It helps you stay focused on the broader trend rather than getting distracted by minor, temporary price fluctuations.
//+------------------------------------------------------------------+
//|                                                        SmWPR.mq4 |
//|                      Copyright é 2006, MetaQuotes Software Corp. |
//|                                        http://www.metaquotes.net |
//+------------------------------------------------------------------+
#property copyright "Copyright é 2006, MetaQuotes Software Corp."
#property link      "http://www.metaquotes.net"

#property indicator_separate_window
#property indicator_buffers 2
#property indicator_color1 Red
#property indicator_color2 Lime

//---- input parameters
extern int       per=8;
extern double    b=0.7;
//---- buffers
double ExtMapBuffer1[];
double ExtMapBuffer2[];


double e1, e2, e3, e4, e5, e6, c1, c2, c3, c4, n, w1, w2, b2, b3;
double  malim, mared, delma, dmone, mlone, mrone, dpnul, dpone, t3, t2;
int shift;
//+------------------------------------------------------------------+
//| Custom indicator initialization function                         |
//+------------------------------------------------------------------+
int init()
  {
//---- indicators


   SetIndexStyle(0,DRAW_HISTOGRAM, STYLE_SOLID, 1);
   SetIndexBuffer(0,ExtMapBuffer1);
   SetIndexEmptyValue(0,0);
   SetIndexStyle(1,DRAW_HISTOGRAM, STYLE_SOLID, 1);
   SetIndexBuffer(1,ExtMapBuffer2);
   SetIndexEmptyValue(1,0);

//----
   return(0);
  }
//+------------------------------------------------------------------+
//| Custom indicator iteration function                              |
//+------------------------------------------------------------------+
int start()
  {   b2=b*b;
      b3=b2*b;
      c1=-b3;
      c2=(3*(b2+b3));
      c3=-3*(2*b2+b+b3);
      c4=(1+3*b+b3+3*b2);
      n=per;

      if (n<1) {n=1;}
      n = 1 + 0.5*(n-1);
      w1 = 2 / (n + 1);
      w2 = 1 - w1;


      for(shift=Bars-per; shift>=0; shift--)
      {
         mlone=iMA(NULL, 0, per, 0, MODE_EMA, PRICE_CLOSE,shift-1);
         mrone=iMA(NULL, 0, per, 0, MODE_EMA, PRICE_CLOSE,shift+4);
         malim=iMA(NULL, 0, per, 0, MODE_EMA, PRICE_CLOSE,shift);
         mared=iMA(NULL, 0, per, 0, MODE_EMA, PRICE_CLOSE,shift+5);


         delma=MathRound((malim-mared)/Point);
         dmone=MathRound((mlone-mrone)/Point);

         dpnul=delma;

         e1 = w1*dpnul + w2*e1;
         e2 = w1*e1 + w2*e2;
         e3 = w1*e2 + w2*e3;
         e4 = w1*e3 + w2*e4;
         e5 = w1*e4 + w2*e5;
         e6 = w1*e5 + w2*e6;

         t3 = c1*e6 + c2*e5 + c3*e4 + c4*e3;

         dpone=dmone;

         e1 = w1*dpone + w2*e1;
         e2 = w1*e1 + w2*e2;
         e3 = w1*e2 + w2*e3;
         e4 = w1*e3 + w2*e4;
         e5 = w1*e4 + w2*e5;
         e6 = w1*e5 + w2*e6;

         t2 = c1*e6 + c2*e5 + c3*e4 + c4*e3;

         if (t3==0) {t3=0.0001;}

         if (t3>t2) {ExtMapBuffer2[shift]=0;ExtMapBuffer1[shift]=t3;}
         if (t3<t2) {ExtMapBuffer1[shift]=0;ExtMapBuffer2[shift]=t3;}

     }

   return(0);
  }
//+------------------------------------------------------------------+
Comments