Trading Hours_v1
Download script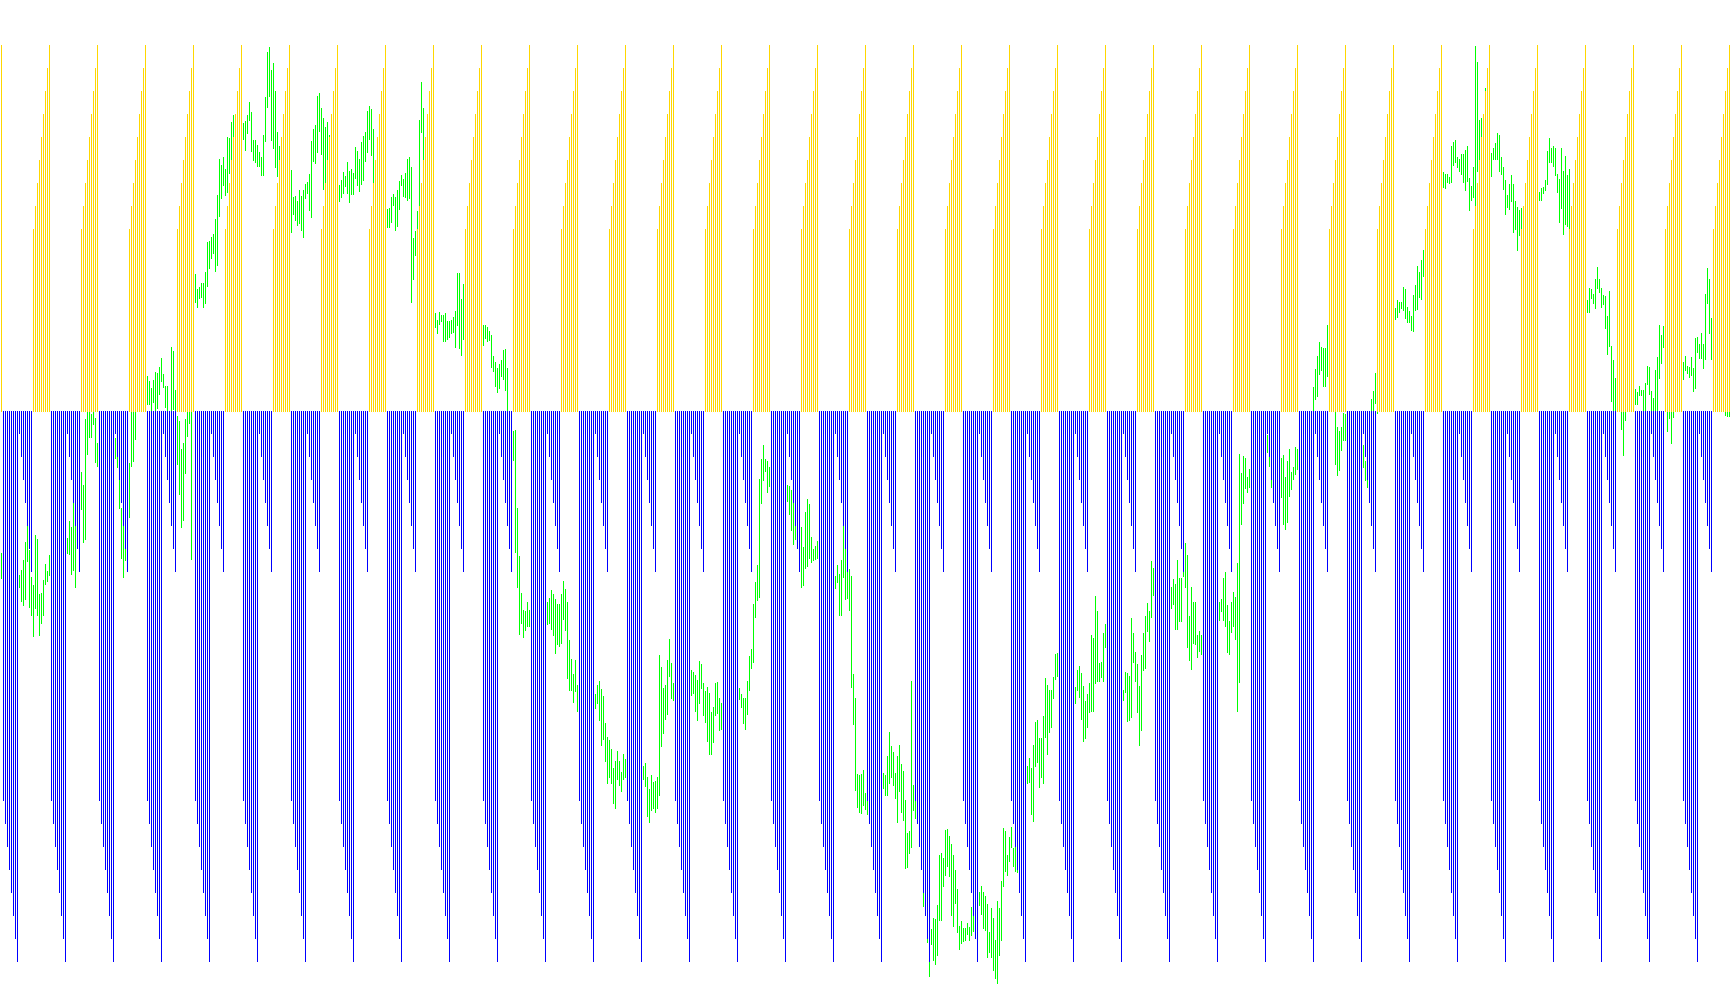
This tool is designed to provide traders with a clear visual reference of specific market trading hours directly on their trading charts. By identifying when a specific financial market (such as the USA market) is active versus when it is closed, it helps users understand liquidity cycles and session timings at a glance.
How the Logic Works
The script functions by analyzing the time data of each candle on your chart and comparing it against pre-defined global time settings. Here is the breakdown of its logic:
Timezone Synchronization Because trading platforms often operate on different server times than local commercial markets, the tool performs a three-step calculation to ensure accuracy:
- It identifies the Server Timezone (the source of your data feed).
- It accounts for the Currency Timezone (the specific region where the market is physically located).
- It calculates the GMT offset to bridge the gap between the platform's clock and the actual local time of the market you are monitoring.
Session Identification Once the correct local time is established, the script checks every historical bar on your chart to see if it falls within your designated "Open" and "Close" hours.
Visual Representation The tool communicates this information using a dual-color histogram located in a separate window at the bottom of your chart:
- Blue Bars: These appear during active market hours. They signify the period when trading volume is typically highest for that specific region.
- Red Bars: These appear during non-market hours, indicating periods of lower liquidity or market closure.
Key Features for the User
- Customizable Market Focus: You can define which market you are tracking (e.g., USA) and set specific opening and closing hours to match your trading strategy.
- Dynamic Growth: The bars automatically adjust and grow according to the progression of the day, providing a continuous visual timeline of the trading day.
- Historical Context: Because the script scans historical data, it allows you to look back at past days to see exactly when specific sessions occurred relative to price action.
/*-----------------------------+
|			       |
| Shared by www.Aptrafx.com    |
|			       |
+------------------------------*/

//+------------------------------------------------------------------+
//+------------------------------------------------------------------+
//by Gilani
// currencyTimeZone - adjust to the timezone of the relevant currency.
// serverTimeZone - timezone of the source of data source feed (+1 Russian zone for MetaTrader)
// blue bars represent open market hours
// red  bars represent close mrket hours
// the bars grows according to the hours of the day

#property copyright "Copyright © 2005, MetaQuotes Software Corp."
#property link      "http://www.metaquotes.net"

#property indicator_separate_window
#property indicator_buffers 2
#property indicator_color1 Blue
#property indicator_color2 Red
//+------------------------------------------------------------------+
//| Custom indicator initialization function                         |
//+------------------------------------------------------------------+

extern int currencyTimeZone = -5;
extern string market = "USA";
int serverTimeZone = +1;
int marketOpensAt = 8;
int marketClosesAt = 16;

double open[];
double close[];

int init()
  {
//---- indicators
//----
   IndicatorBuffers(2);
   SetIndexStyle(0,DRAW_HISTOGRAM);
   SetIndexBuffer(0,open);
   SetIndexLabel(0,"Blue");
   SetIndexStyle(1,DRAW_HISTOGRAM);
   SetIndexBuffer(1,close);
   SetIndexLabel(1,"Red");
//----
   IndicatorShortName("Trading Hours: "+market);
   return(0);
  }
//+------------------------------------------------------------------+
//| Custor indicator deinitialization function                       |
//+------------------------------------------------------------------+
int deinit()
  {
//---- TODO: add your code here

//----
   return(0);
  }
//+------------------------------------------------------------------+
//| Custom indicator iteration function                              |
//+------------------------------------------------------------------+
int start()
  {
   int limit;
   int ExtCountedBars=IndicatorCounted();
   if(ExtCountedBars<0) return(-1);
   if(ExtCountedBars>0) ExtCountedBars--;
   limit=Bars-ExtCountedBars;

   for (int x=limit;x>=0;x--) {
      int gmt = MathMod (24+TimeHour(Time[x])-serverTimeZone, 24);
      int hour = MathMod(24+currencyTimeZone+gmt, 24);

      if ((hour >= marketOpensAt) && (hour <= marketClosesAt)) {

      if (hour==0) hour=24;
         open[x]=hour;
         close[x]=0;
      } else {
         if (hour==0) hour=24;
         open[x]=0;
         close[x]= -hour;

      }
   }

      return(0);
  }
//+------------------------------------------------------------------+
Comments