T3_DPO-v1_v2
Download script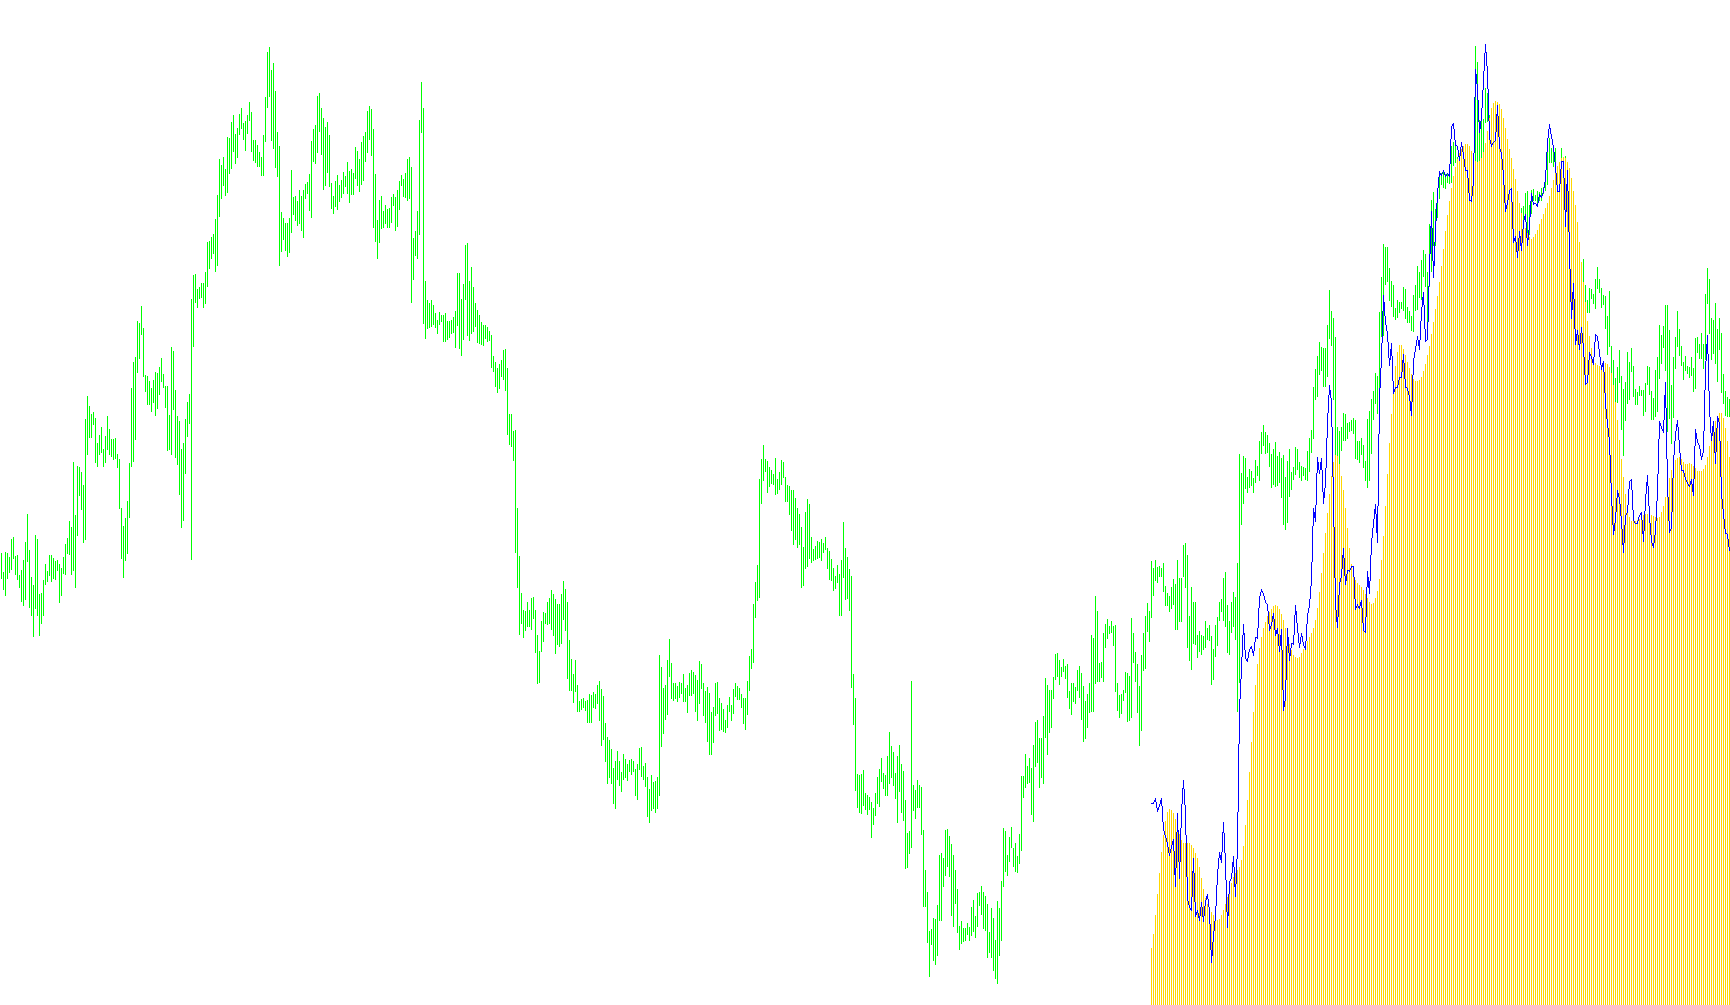
This script functions as a specialized technical analysis tool designed to visualize specific market trends and price momentum. Rather than plotting standard price movements, it creates a unique visual representation in a separate window to help traders identify underlying patterns.
Core Logic and Methodology
The logic behind this tool is built on three primary layers:
1. Smoothing and Weighted Calculations The script begins by taking a standard moving average of the closing prices over a specific period. However, it doesn't stop there; it applies a multi-stage smoothing process. It calculates a series of weighted variables that progressively "filter" the price data. This ensures that minor market noise is reduced, allowing the indicator to focus on more significant, sustained movements.
2. The T3 Mathematical Framework The core of the tool utilizes a specific mathematical formula (referenced as T3). This logic uses a series of coefficients derived from user-defined parameters to weight different historical price points. By multiplying these smoothed values by specific constants, the script generates a final output that is more responsive to recent price changes than a traditional moving average, while still maintaining a smooth appearance.
3. Visual Output The final result is rendered in two distinct ways on your chart:
- Histogram: This represents the calculated T3 values, showing the strength and direction of the trend relative to a zero baseline.
- Line Plot: This tracks the closing prices, providing a secondary reference point to see how the actual price behaves alongside the smoothed indicator.
How it Works for the User
When you apply this script, it looks back at your historical data (up to a user-defined limit) and performs these heavy mathematical calculations instantly. It then draws a histogram that helps you "see" the momentum of the market. Because it uses a weighted smoothing technique, it aims to provide a cleaner picture of price action than raw price charts alone might offer, helping to distinguish between temporary fluctuations and actual trend shifts.
//+------------------------------------------------------------------+
//|                                                    T3_DPO-v1.mq4 |
//|                                                                  |
//|                                        Ramdass - Conversion only |
//+------------------------------------------------------------------+
#property indicator_separate_window
#property indicator_buffers 2
#property indicator_color1 Green
#property indicator_color2 DarkViolet
//---- input parameters
extern int x_prd=0;
extern int t3_period=8;
extern double b=0.7;
extern int CountBars=300;
//---- buffers
double t3[];
double prise[];
//+------------------------------------------------------------------+
//| Custom indicator initialization function                         |
//+------------------------------------------------------------------+
int init()
  {
//---- indicator line
   IndicatorBuffers(2);
   SetIndexBuffer(0,t3);
   SetIndexBuffer(1,prise);
   SetIndexStyle(0,DRAW_HISTOGRAM);
   SetIndexStyle(1,DRAW_LINE);
//----
//----
   return(0);
  }
//+------------------------------------------------------------------+
//| T3_DPO-v1                                                        |
//+------------------------------------------------------------------+
int start()
  {
   SetIndexDrawBegin(0,Bars-CountBars+t3_period+1);
   SetIndexDrawBegin(1,Bars-CountBars+t3_period+1);
   int i,counted_bars=IndicatorCounted();
   double e1,e2,e3,e4,e5,e6,c1,c2,c3,c4,n,w1,w2, b2,b3,dpo,Prise;
//----
   if(Bars<=t3_period) return(0);
//---- initial zero
   if(counted_bars<t3_period)
     {
      for(i=1;i<=t3_period;i++) prise[Bars-i]=0.0;
      for(i=1;i<=t3_period;i++) t3[Bars-i]=0.0;
     }
//----
   b2=b*b;
   b3=b2*b;
   c1=-b3;
   c2=(3*(b2+b3));
   c3=-3*(2*b2+b+b3);
   c4=(1+3*b+b3+3*b2);
   n=t3_period;
//----
   if (n<1) n=1;
   n=1 + 0.5*(n-1);
   w1=2/(n + 1);
   w2=1 - w1;
//----
   i=Bars-CountBars-1;
   if(counted_bars>=t3_period) i=CountBars-counted_bars-1;
   while(i>=0)
     {
      dpo=iMA(NULL,0,t3_period,0,MODE_SMA,PRICE_CLOSE,i);
//----
      e1=w1*dpo + w2*e1;
      e2=w1*e1 + w2*e2;
      e3=w1*e2 + w2*e3;
      e4=w1*e3 + w2*e4;
      e5=w1*e4 + w2*e5;
      e6=w1*e5 + w2*e6;
//----
      t3[i]=c1*e6 + c2*e5 + c3*e4 + c4*e3;
//----
      prise[i]=Close[i];
      i--;
     }
   return(0);
  }
//+------------------------------------------------------------------+
Comments