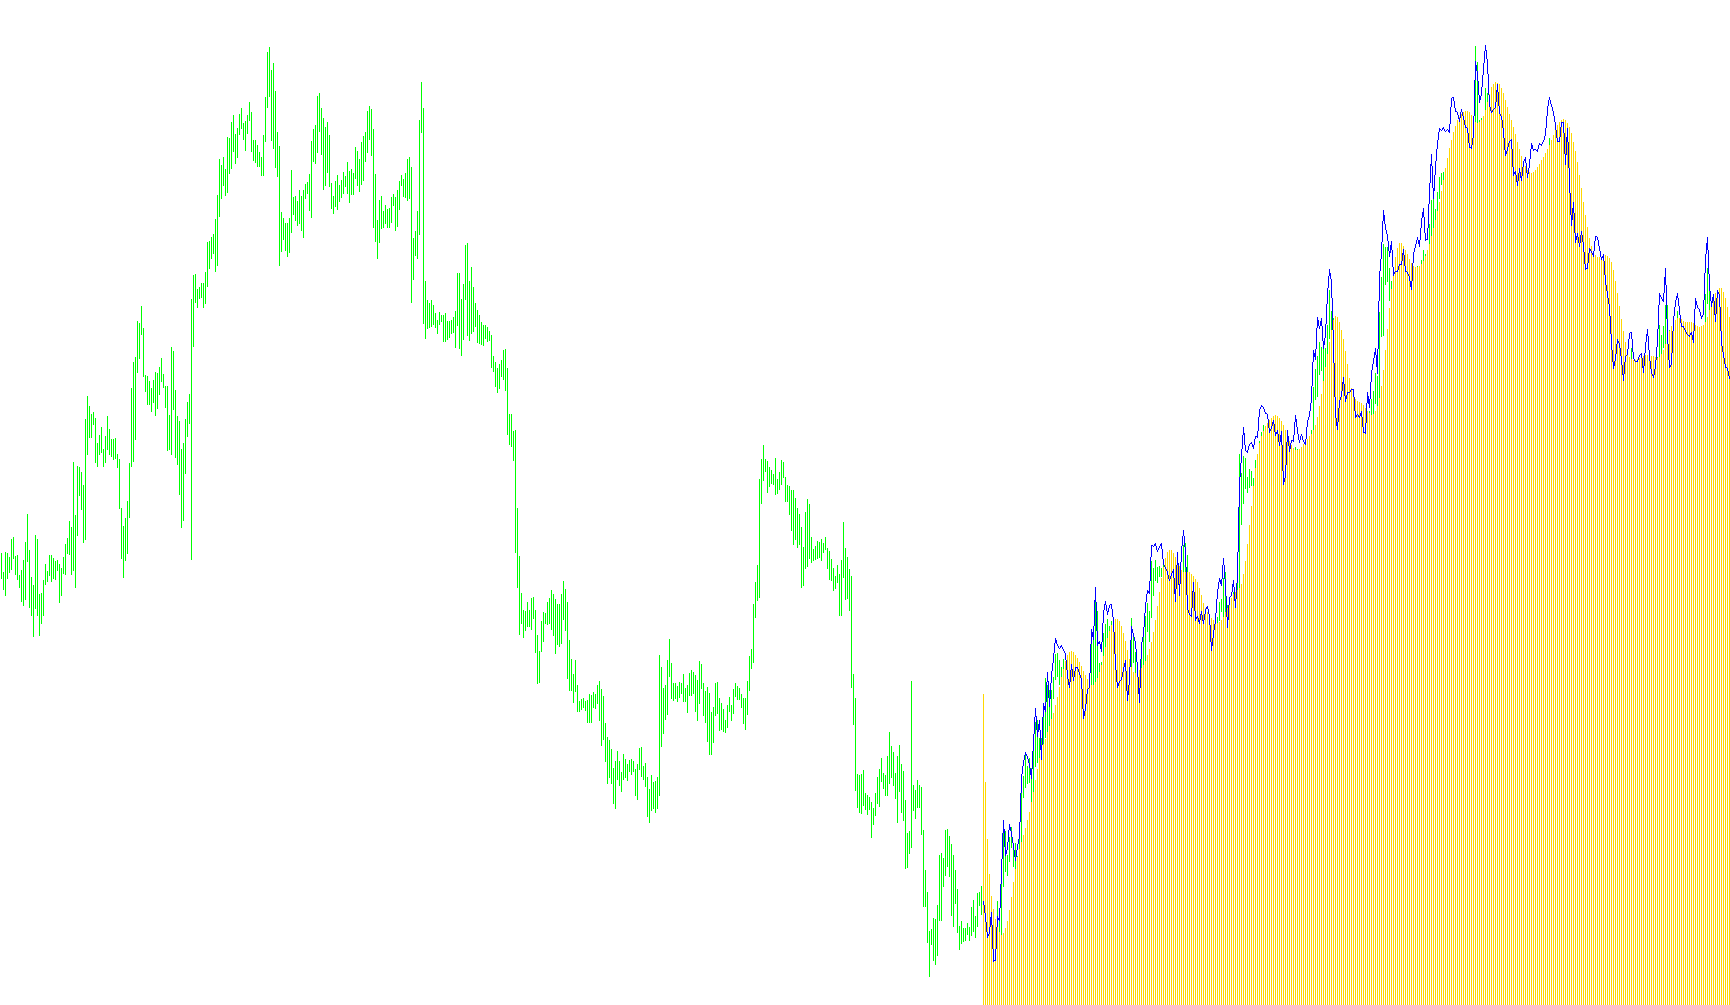
This tool is designed as a visual technical indicator for trading platforms, providing a smoothed representation of price movement to help identify trends and momentum. Rather than showing raw price action, it processes data through a multi-layered mathematical filter to create a cleaner, more refined output.
Core Logic Overview
The indicator operates using two primary components: a Smoothing Engine and a Trend Calculation.
1. The Smoothing Engine (Triple Exponential Smoothing)
The script utilizes a sophisticated smoothing technique often referred to as "T3." Unlike standard moving averages that can be sluggish or lag significantly behind the current price, this logic applies multiple layers of weighting.
- It takes the current market data and calculates a weighted average based on specific coefficients (defined by your settings).
- This value is then fed back into the formula repeatedly to "triple" the smoothing effect.
- The result is a line that flows smoothly over the price action, filtering out "market noise" and minor fluctuations while remaining responsive to significant shifts in direction.
2. Price Positioning (DPO Logic)
By incorporating "DPO" (Detrended Price Oscillator) logic, the script aims to isolate the cyclical movements of the market from its long-term trend. It measures where the current price sits in relation to the smoothed average. This allows traders to see whether the price is currently overextended or if it is following the primary momentum.
3. Visual Representation
The tool outputs two distinct visual elements in a separate window:
- A Histogram: This provides a dynamic visual of the trend intensity and direction.
- A Line Plot: This tracks the underlying price data relative to the smoothed calculations, allowing for a clearer comparison between actual market activity and the calculated trend.
Summary of Behavior
When you load this script, it looks back at a specific number of past candles (defined by your settings) and performs these heavy mathematical calculations for every single point. It effectively "cleans" the price data, producing a visual guide that helps identify whether the current market move is a significant trend or just temporary volatility.
//+------------------------------------------------------------------+
//|                                                    T3_DPO-v3.mq4 |
//|                                                                  |
//|                                                                  |
//+------------------------------------------------------------------+
#property indicator_separate_window
#property indicator_buffers 2
#property indicator_color1 Green
#property indicator_color2 DarkViolet
//---- input parameters
extern int x_prd=0;
extern int t3_period=8;
extern double b=0.7;
extern int CountBars=400;
//---- buffers
double t3[];
double prise[];
//+------------------------------------------------------------------+
//| Custom indicator initialization function |
//+------------------------------------------------------------------+
int init()
{
//---- indicator line
IndicatorBuffers(2);
SetIndexBuffer(0,t3);
SetIndexBuffer(1,prise);
SetIndexStyle(0,DRAW_HISTOGRAM);
SetIndexStyle(1,DRAW_LINE);

//----

//----
return(0);
}
//+------------------------------------------------------------------+
//| T3_DPO-v3 |
//+------------------------------------------------------------------+
int start()
{
if (CountBars>Bars) CountBars=Bars;
SetIndexDrawBegin(0,Bars-CountBars+t3_period*3+1);
SetIndexDrawBegin(1,Bars-CountBars+t3_period*3+1);
int i,counted_bars=IndicatorCounted();
// if (CountBars>counted_bars) CountBars=counted_bars;
double e1,e2,e3,e4,e5,e6,c1,c2,c3,c4,n,w1,w2, b2,b3,dpo,Prise;
//----
if(Bars<=t3_period) return(0);
//---- initial zero
if(counted_bars<t3_period)
{
for(i=1;i<=t3_period;i++) prise[Bars-i]=0.0;
for(i=1;i<=t3_period;i++) t3[Bars-i]=0.0;
}
//----
b2=b*b;
b3=b2*b;
c1=-b3;
c2=(3*(b2+b3));
c3=-3*(2*b2+b+b3);
c4=(1+3*b+b3+3*b2);
n=t3_period;

if (n<1) n=1;
n = 1 + 0.5*(n-1);
w1 = 2 / (n + 1);
w2 = 1 - w1;
//----
i=CountBars-t3_period-1;
// if(counted_bars>=t3_period) i=Bars-counted_bars-1;
while(i>=0)
{
dpo=iMA(NULL,0,t3_period,0,MODE_SMA,PRICE_CLOSE,i);

e1 = w1*dpo + w2*e1;
e2 = w1*e1 + w2*e2;
e3 = w1*e2 + w2*e3;
e4 = w1*e3 + w2*e4;
e5 = w1*e4 + w2*e5;
e6 = w1*e5 + w2*e6;

t3[i] = c1*e6 + c2*e5 + c3*e4 + c4*e3;

prise[i]=Close[i];

i--;
}
return(0);
}
//+------------------------------------------------------------------+
Comments