VininI_MV_WPR(v1)
Download script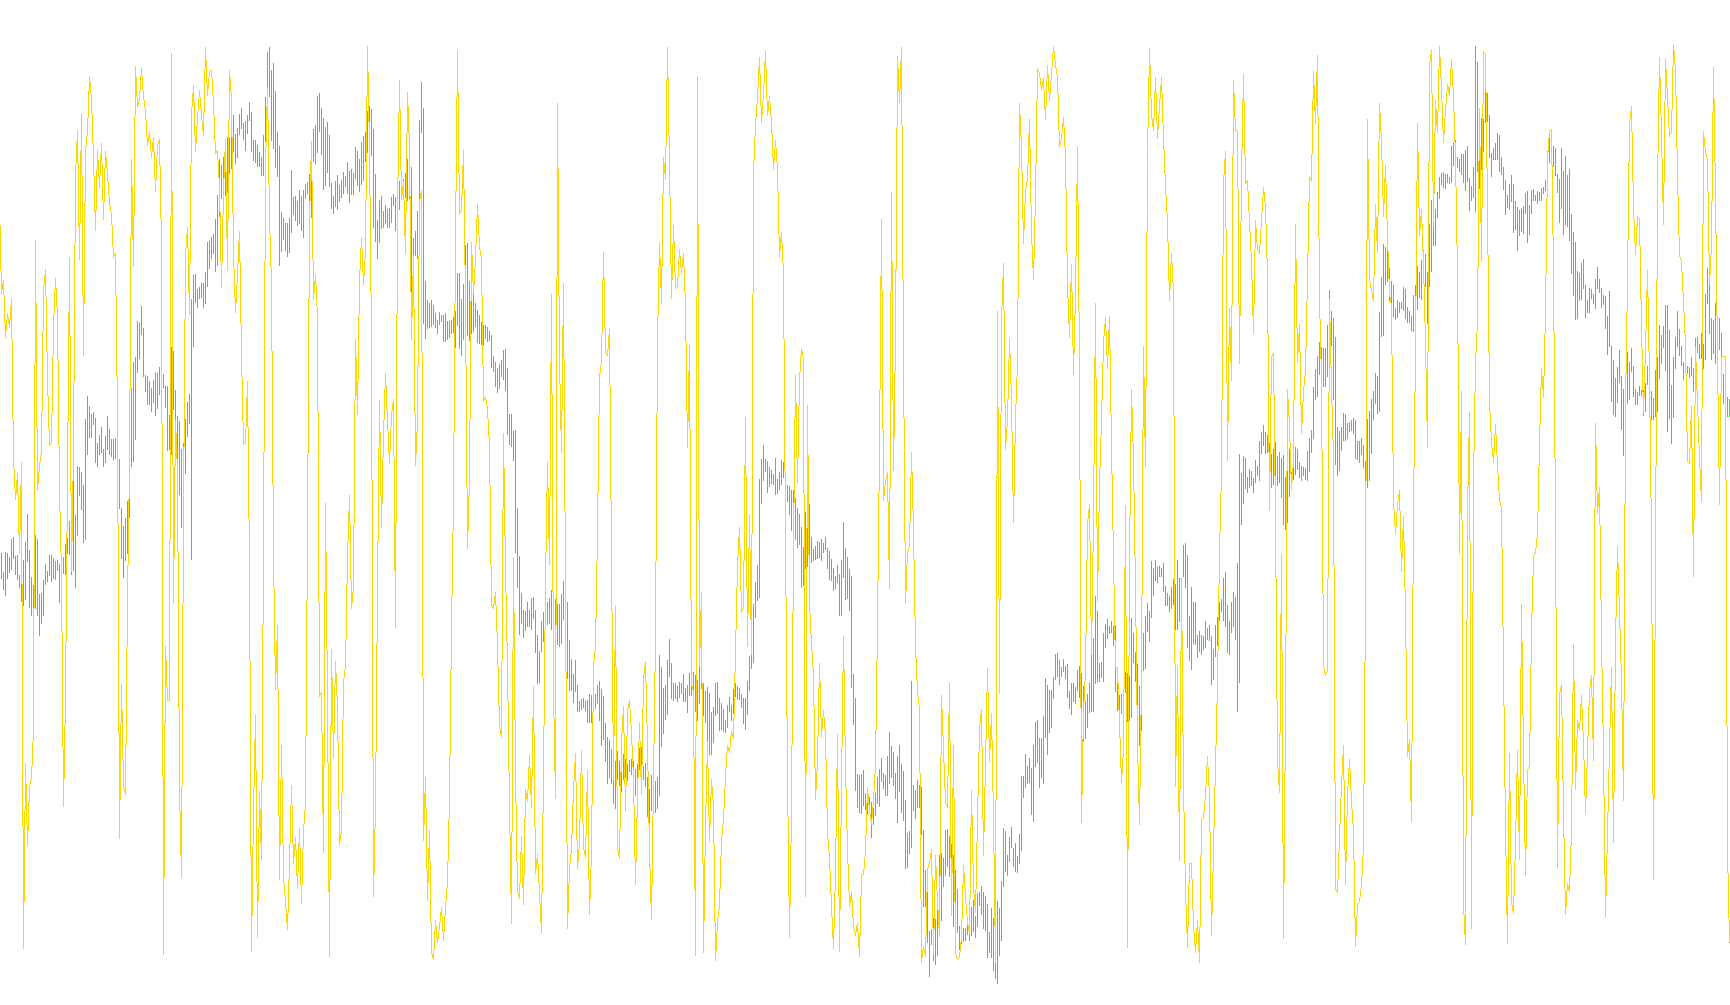
This tool is designed to provide traders with a specialized visual representation of market momentum by tracking the relationship between the current asset and a secondary reference currency pair. Rather than looking at price action in isolation, this script helps identify "overbought" or "oversold" conditions based on comparative strength.
Core Functionality
Multi-Symbol Correlation The primary logic of this script involves monitoring a specific foreign currency pair (by default, GBPUSD) to help interpret the movement of the asset you are currently viewing. It acts as a secondary lens, allowing you to see how a major global pair influences your primary trade setup.
Data Normalization and Scaling Standard momentum oscillators can sometimes be difficult to read because their values may fluctuate wildly or sit in areas that aren't easily comparable to other charts. This script automatically takes the standard "Williams Percent Range" (WPR) data and applies a mathematical transformation:
- It shifts the values into a centered range.
- It scales the results so they fit clearly between -100 and +100.
- This creates a balanced, symmetrical visual that makes it much easier to identify trend reversals or extremes at a glance.
Smart Synchronization (The "Reversi" Logic) One of the most important features of this script is its ability to detect currency positioning. If you are trading a pair where the USD is not in the primary position (for example, trading EURUSD vs. GBPUSD), the script detects this difference. To ensure the data remains logically consistent for the trader, it automatically "reverses" the visual signal. This ensures that the momentum shown on your screen always reflects the same directional logic, regardless of which way the currency pair is quoted.
Efficiency and Performance The script is engineered to be lightweight. It includes a "Limit" feature that restricts how much historical data is calculated at one time, preventing the platform from slowing down during high-volatility periods. It also intelligently calculates the correct position of the reference symbol relative to your current chart's time, ensuring that the data you see is perfectly aligned with the candles on your screen.
How it helps the trader
By using this logic, a trader can look for specific "zones" on the indicator (specifically around the 0, 60, and -60 levels). When the visual line hits these extremes, it suggests that the secondary market may be stretched in one direction, potentially signaling an upcoming price correction or a trend exhaustion in the primary asset you are trading.
//+------------------------------------------------------------------+
//|                                             VininI_MV_WPR_v1.mq4 |
//|                                         Victor Nicolaev aka Vinin|
//|                                                    vinin@mail.ru |
//+------------------------------------------------------------------+
#property copyright "Ñopyright 2008. Victor Nicolaev aka Vinin"
#property link      "e-mail: vinin@mail.ru"

#property indicator_separate_window
#property indicator_buffers 1
#property indicator_color1 Aqua

#property indicator_level1 0
#property indicator_level2 60
#property indicator_level3 -60

#property indicator_maximum 100
#property indicator_minimum -100
//---- input parameters

extern string WPR_Symbol="GBPUSD";
extern int WPR_Period= 14;
extern int Limit=1440;

int reversi;

double WPR[];

//+------------------------------------------------------------------+
//| Custom indicator initialization function                         |
//+------------------------------------------------------------------+
int init() {

   SetIndexStyle(0,DRAW_LINE);
   SetIndexDrawBegin(0,WPR_Period);
   SetIndexBuffer(0,WPR);
   IndicatorShortName(WPR_Symbol+"(WPR,"+WPR_Period+")");
   SetIndexLabel(0,WPR_Symbol+"(WPR)");
   reversi=0;
   if (StringFind(Symbol(),"USD",0)!=StringFind(WPR_Symbol,"USD",0)) reversi=1;
   return(0); }

//+------------------------------------------------------------------+
int start() {
   static int TimeWPR=-1;
   int limit;
   int counted_bars=IndicatorCounted();
   int i, CurrentTime, WPRPos;

   if(counted_bars<0) return(-1);
   if(counted_bars>0) counted_bars--;
   limit=Bars-counted_bars;

   if (limit>Limit && Limit>0) limit = Limit;
   if (TimeWPR>0) limit+=iBarShift(WPR_Symbol,Period(),TimeWPR);
   for (i = limit;i>=0;i--){
      CurrentTime=Time[i];
      WPRPos=iBarShift(WPR_Symbol,Period(),CurrentTime);
      if (iTime(WPR_Symbol,Period(),WPRPos)<CurrentTime) WPRPos++;
      WPR[i] = (iWPR(WPR_Symbol,Period(),WPR_Period,WPRPos)+50.0)*2.0;
      if (reversi!=0) WPR[i]*=-1.0;

   }
   TimeWPR=iTime(WPR_Symbol,Period(),0);


   return(0);
}// int start()
Comments