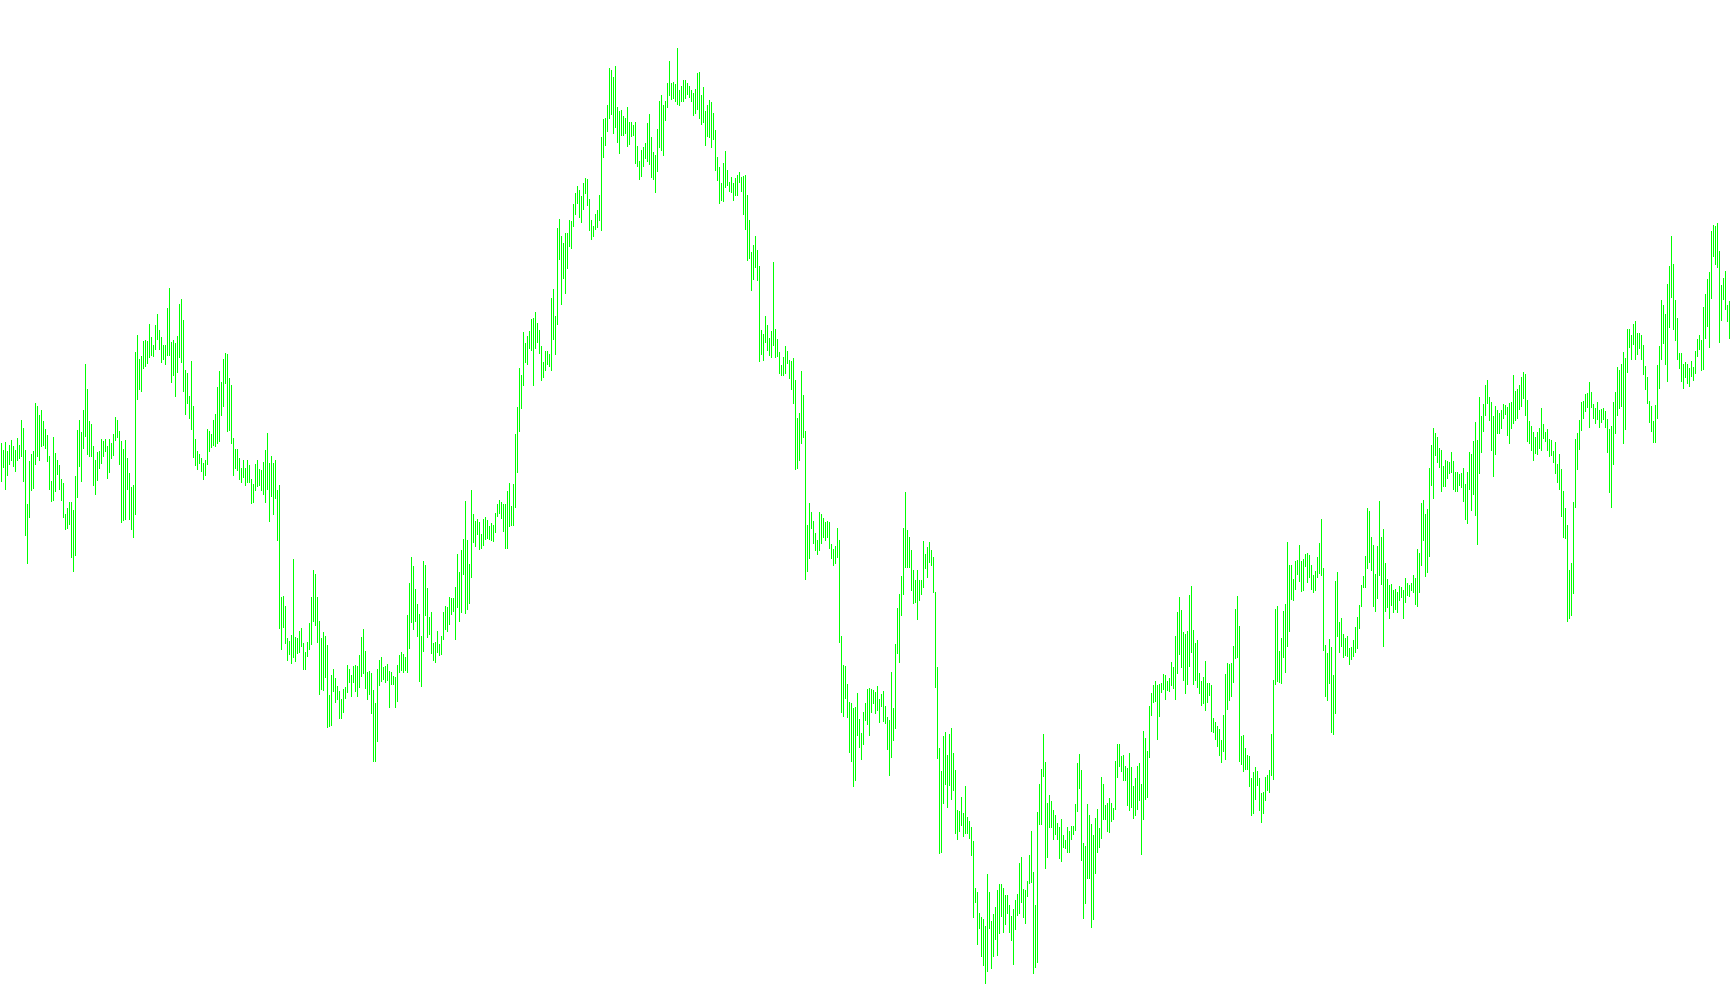
This script is designed to identify and highlight potential turning points in a price chart, specifically peaks (high points) and troughs (low points). It does this by using a modified version of a technique called a "ZigZag" indicator. Here's the breakdown:
-
Defining the Landscape: The script first sets up the visual elements - the color (Lime for low points, Red for high points) and thickness of the arrows that will mark the turning points on the chart. It also defines three key settings that control how sensitive the turning point detection is:
ExtDepth: This determines how far back the script looks to find potential peaks and troughs. Think of it as the "lookback period." A larger value means it considers a longer historical window.ExtDeviation: This setting acts as a filter. A potential peak or trough must be significantly different (by this much) from the current price to be considered valid. It prevents the script from marking minor price fluctuations as turning points.ExtBackstep: This prevents the script from drawing too many signals too close together. If a potential turning point is found, this setting dictates how many bars to the right (future) will be checked and previous signals erased if needed to clean up the signals.
-
Finding Potential Turning Points: The core of the script scans the price data bar by bar, from right to left (from the most recent bar to the past, within the "lookback period" specified by
ExtDepth). For each bar, it does the following:- Looks for Low Points (Troughs): It finds the lowest price within the
ExtDepthperiod. If this lowest price is significantly different enough from the current price based on theExtDeviationsetting, it marks this as a potential low point. - Looks for High Points (Peaks): It finds the highest price within the
ExtDepthperiod. If this highest price is significantly different enough from the current price based on theExtDeviationsetting, it marks this as a potential high point. - Cleaning the signals The script clears the number of
ExtBackstepsignals to clean the signals.
- Looks for Low Points (Troughs): It finds the lowest price within the
-
Refining the Turning Points: After the initial scan, the script goes through the potential turning points again to refine them. This step is crucial for removing false signals and ensuring only the most significant turning points are highlighted. This cleaning process works like this:
- Comparing High Points: If two high points are found close together, the script compares their values. If the newer high point is higher than the previous one, the older high point is discarded, and the new one is kept. This ensures only the highest high point in a short period is marked.
- Comparing Low Points: The same logic applies to low points. If a newer low point is lower than the previous one, the older low point is discarded, and the new one is kept.
- Prioritizing Clear Signals: If it finds a signal where both a high and a low point exists at the same time, it skips over this signal.
-
Final Touches: The script scans through the bars once more to erase old signals, then draws the arrows on the chart to indicate the identified high and low points.
In essence, this script attempts to identify significant peaks and troughs in price movements by analyzing price data within a specific historical window and filtering out minor fluctuations. The key settings (ExtDepth, ExtDeviation, and ExtBackstep) control the sensitivity and accuracy of the indicator, and adjusting these settings allows you to fine-tune the script's behavior to match the specific characteristics of the market you are analyzing.
//+------------------------------------------------------------------+
//|                                               ZigZag Pointer.mq4 |
//|                                    zigzag modified by Dr. Gaines |
//|                                      dr_richard_gaines@yahoo.com |
//|                                        http://www.metaquotes.net |
//+------------------------------------------------------------------+
#property copyright "dr_richard_gaines"
#property link      "http://www.metaquotes.net/"

#property indicator_chart_window
#property indicator_buffers 2
#property indicator_color1 Lime
#property indicator_width1 1
#property indicator_color2 Red
#property indicator_width2 1
//---- indicator parameters
extern int ExtDepth=100;
extern int ExtDeviation=75;
extern int ExtBackstep=15;
//---- indicator buffers
double ExtMapBuffer[];
double ExtMapBuffer2[];

//+------------------------------------------------------------------+
//| Custom indicator initialization function                         |
//+------------------------------------------------------------------+
int init()
  {
   IndicatorBuffers(2);
//---- drawing settings
   SetIndexStyle(0,DRAW_ARROW);
   SetIndexArrow(0, 233);
   SetIndexStyle(1,DRAW_ARROW);
   SetIndexArrow(1, 234);
//---- indicator buffers mapping
   SetIndexBuffer(0,ExtMapBuffer);
   SetIndexBuffer(1,ExtMapBuffer2);
   SetIndexEmptyValue(0,0.0);

//---- indicator short name
   IndicatorShortName("ZigZag("+ExtDepth+","+ExtDeviation+","+ExtBackstep+")");
//---- initialization done
   return(0);
  }
//+------------------------------------------------------------------+
//|                                                                  |
//+------------------------------------------------------------------+
int start()
  {
   int    shift, back,lasthighpos,lastlowpos;
   double val,res;
   double curlow,curhigh,lasthigh,lastlow;

   for(shift=Bars-ExtDepth; shift>=0; shift--)
     {
      val=Low[Lowest(NULL,0,MODE_LOW,ExtDepth,shift)];
      if(val==lastlow) val=0.0;
      else
        {
         lastlow=val;
         if((Low[shift]-val)>(ExtDeviation*Point)) val=0.0;
         else
           {
            for(back=1; back<=ExtBackstep; back++)
              {
               res=ExtMapBuffer[shift+back];
               if((res!=0)&&(res>val)) ExtMapBuffer[shift+back]=0.0;
              }
           }
        }
      ExtMapBuffer[shift]=val;
      //--- high
      val=High[Highest(NULL,0,MODE_HIGH,ExtDepth,shift)];
      if(val==lasthigh) val=0.0;
      else
        {
         lasthigh=val;
         if((val-High[shift])>(ExtDeviation*Point)) val=0.0;
         else
           {
            for(back=1; back<=ExtBackstep; back++)
              {
               res=ExtMapBuffer2[shift+back];
               if((res!=0)&&(res<val)) ExtMapBuffer2[shift+back]=0.0;
              }
           }
        }
      ExtMapBuffer2[shift]=val;
     }

   // final cutting
   lasthigh=-1; lasthighpos=-1;
   lastlow=-1;  lastlowpos=-1;

   for(shift=Bars-ExtDepth; shift>=0; shift--)
     {
      curlow=ExtMapBuffer[shift];
      curhigh=ExtMapBuffer2[shift];
      if((curlow==0)&&(curhigh==0)) continue;
      //---
      if(curhigh!=0)
        {
         if(lasthigh>0)
           {
            if(lasthigh<curhigh) ExtMapBuffer2[lasthighpos]=0;
            else ExtMapBuffer2[shift]=0;
           }
         //---
         if(lasthigh<curhigh || lasthigh<0)
           {
            lasthigh=curhigh;
            lasthighpos=shift;
           }
         lastlow=-1;
        }
      //----
      if(curlow!=0)
        {
         if(lastlow>0)
           {
            if(lastlow>curlow) ExtMapBuffer[lastlowpos]=0;
            else ExtMapBuffer[shift]=0;
           }
         //---
         if((curlow<lastlow)||(lastlow<0))
           {
            lastlow=curlow;
            lastlowpos=shift;
           }
         lasthigh=-1;
        }
     }

   for(shift=Bars-1; shift>=0; shift--)
     {
      if(shift>=Bars-ExtDepth) ExtMapBuffer[shift]=0.0;
      else
        {
         res=ExtMapBuffer2[shift];
         if(res!=0.0) ExtMapBuffer2[shift]=res;
        }
     }
  }

  //end//
Comments