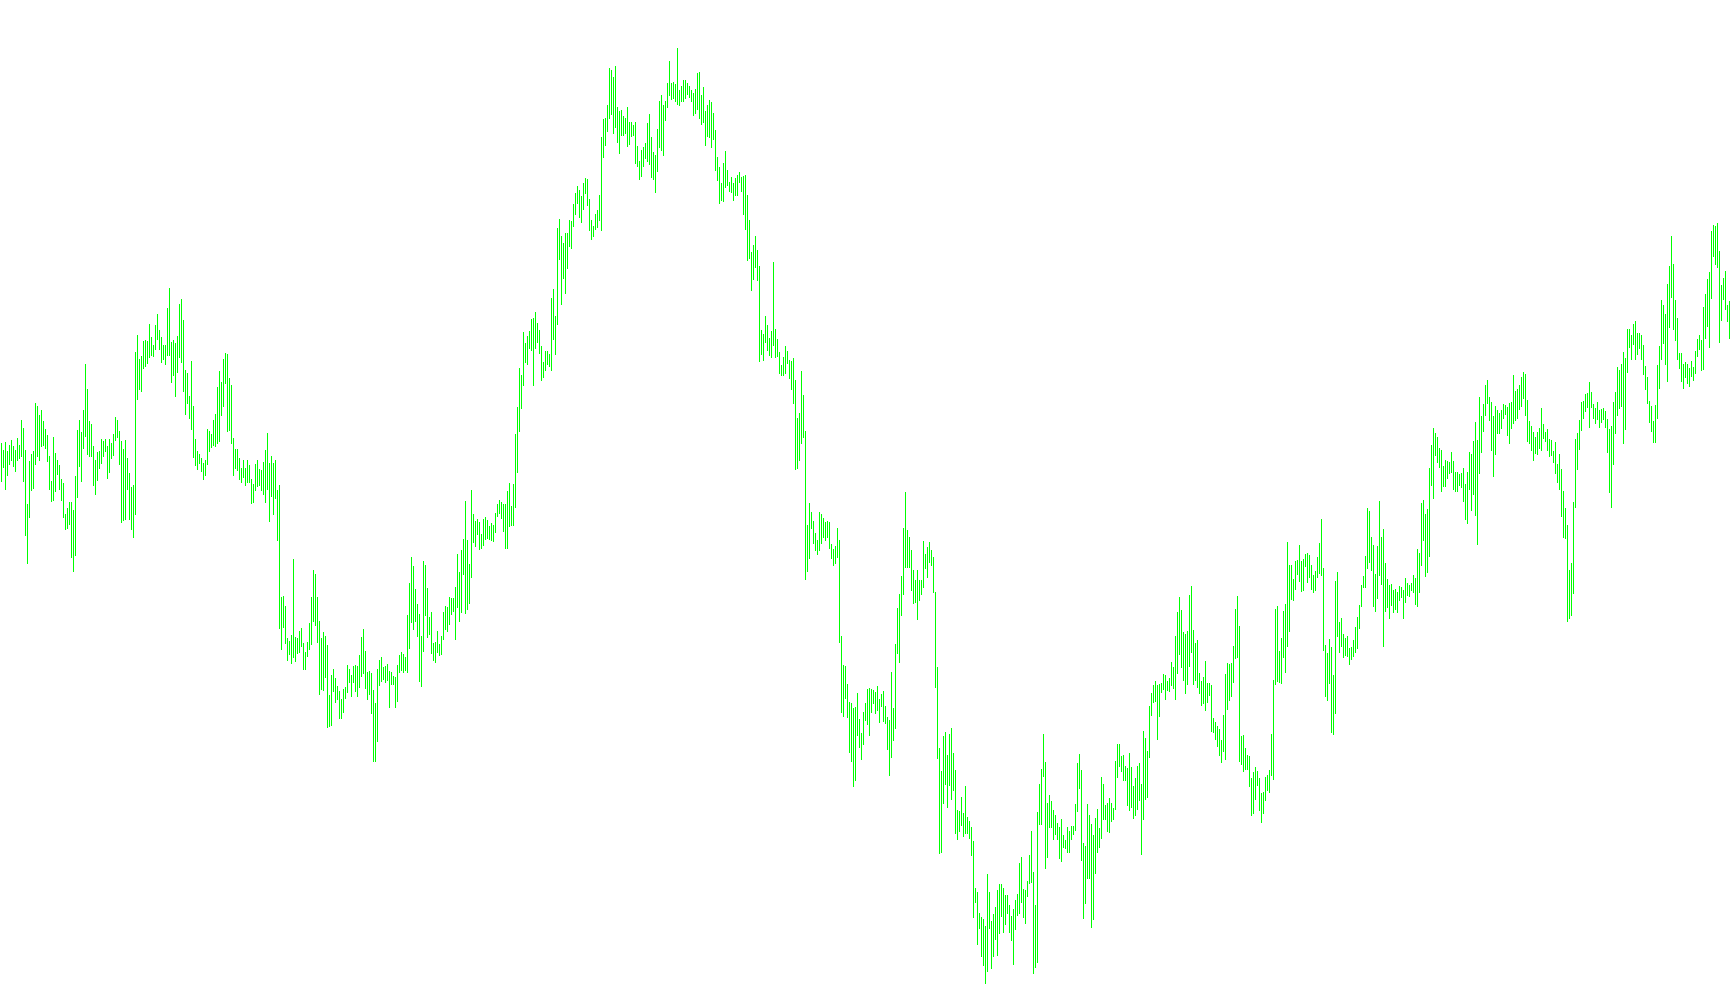
This script is designed to identify and visualize key structural turning points in market price action, specifically highlighting significant highs and lows. It functions by filtering out minor market noise to reveal the broader "zigzag" pattern of price movements.
Core Logic Overview
The tool works by scanning historical price data to detect prominent peaks and valleys based on three main user-defined criteria: Depth, Deviation, and Backstep.
- Identification of Extremes: The script looks back over a specific window of time (Depth) to find the highest highs and lowest lows. It then evaluates these points to see if they represent a meaningful change in direction.
- Filtering Noise: To ensure the chart isn't cluttered with every tiny fluctuation, the tool uses a "Deviation" threshold. This means a new high or low is only recognized if it moves a significant enough distance from the previous price point.
- Refinement and Backstep: The "Backstep" logic ensures that multiple points in very close proximity aren't all marked as significant. It acts as a buffer, ensuring that the script prioritizes the most distinct turning points rather than every small wiggle in the line.
Visual Behavior (The "ZigZag" Effect)
The script processes the data in two main passes to ensure accuracy:
- Initial Mapping: It first scans the price history and places markers on potential high and low points that meet the depth and deviation requirements.
- Dynamic Updating: The logic is "reactive." As new price data comes in, if a new high is formed that is higher than the previous marked high, the script automatically updates the marker. If a new point is found that contradicts a previous one (e.g., a lower low appearing before a confirmed high), the script "cleans" the chart by removing the outdated marker and placing it at the new, more accurate location.
Final Output
The result for the user is a clean, visual representation of market structure. Instead of seeing every single price tick, you see a series of points (arrows) that define the major legs of a trend. This helps in identifying support and resistance levels, as well as understanding the overall momentum of the market.
//+------------------------------------------------------------------+
//|                                               ZigZag Pointer.mq4 |
//|                                    zigzag modified by Dr. Gaines |
//|                                      dr_richard_gaines@yahoo.com |
//|                                        http://www.metaquotes.net |
//+------------------------------------------------------------------+
#property copyright "dr_richard_gaines"
#property link      "http://www.metaquotes.net/"
//----
#property indicator_chart_window
#property indicator_buffers 2
#property indicator_color1 Lime
#property indicator_width1 1
#property indicator_color2 Red
#property indicator_width2 1
//---- indicator parameters
extern int ExtDepth=12;
extern int ExtDeviation=5;
extern int ExtBackstep=3;
//---- indicator buffers
double ExtMapBuffer[];
double ExtMapBuffer2[];
//+------------------------------------------------------------------+
//| Custom indicator initialization function                         |
//+------------------------------------------------------------------+
int init()
  {
   IndicatorBuffers(2);
//---- drawing settings
   SetIndexStyle(0,DRAW_ARROW);
   SetIndexArrow(0, 233);
   SetIndexStyle(1,DRAW_ARROW);
   SetIndexArrow(1, 234);
//---- indicator buffers mapping
   SetIndexBuffer(0,ExtMapBuffer);
   SetIndexBuffer(1,ExtMapBuffer2);
   SetIndexEmptyValue(0,0.0);
//---- indicator short name
   IndicatorShortName("ZigZag("+ExtDepth+","+ExtDeviation+","+ExtBackstep+")");
//---- initialization done
   return(0);
  }
//+------------------------------------------------------------------+
//|                                                                  |
//+------------------------------------------------------------------+
int start()
  {
   int    shift, back,lasthighpos,lastlowpos;
   double val,res;
   double curlow,curhigh,lasthigh,lastlow;
//----
   for(shift=Bars-ExtDepth; shift>=0; shift--)
     {
      val=Low[Lowest(NULL,0,MODE_LOW,ExtDepth,shift)];
      if(val==lastlow) val=0.0;
      else
        {
         lastlow=val;
         if((Low[shift]-val)>(ExtDeviation*Point)) val=0.0;
         else
           {
            for(back=1; back<=ExtBackstep; back++)
              {
               res=ExtMapBuffer[shift+back];
               if((res!=0)&&(res>val)) ExtMapBuffer[shift+back]=0.0;
              }
           }
        }
      ExtMapBuffer[shift]=val;
      //--- high
      val=High[Highest(NULL,0,MODE_HIGH,ExtDepth,shift)];
      if(val==lasthigh) val=0.0;
      else
        {
         lasthigh=val;
         if((val-High[shift])>(ExtDeviation*Point)) val=0.0;
         else
           {
            for(back=1; back<=ExtBackstep; back++)
              {
               res=ExtMapBuffer2[shift+back];
               if((res!=0)&&(res<val)) ExtMapBuffer2[shift+back]=0.0;
              }
           }
        }
      ExtMapBuffer2[shift]=val;
     }
   // final cutting
   lasthigh=-1; lasthighpos=-1;
   lastlow=-1;  lastlowpos=-1;
//----
   for(shift=Bars-ExtDepth; shift>=0; shift--)
     {
      curlow=ExtMapBuffer[shift];
      curhigh=ExtMapBuffer2[shift];
      if((curlow==0)&&(curhigh==0)) continue;
      //---
      if(curhigh!=0)
        {
         if(lasthigh>0)
           {
            if(lasthigh<curhigh) ExtMapBuffer2[lasthighpos]=0;
            else ExtMapBuffer2[shift]=0;
           }
         //---
         if(lasthigh<curhigh || lasthigh<0)
           {
            lasthigh=curhigh;
            lasthighpos=shift;
           }
         lastlow=-1;
        }
      //----
      if(curlow!=0)
        {
         if(lastlow>0)
           {
            if(lastlow>curlow) ExtMapBuffer[lastlowpos]=0;
            else ExtMapBuffer[shift]=0;
           }
         //---
         if((curlow<lastlow)||(lastlow<0))
           {
            lastlow=curlow;
            lastlowpos=shift;
           }
         lasthigh=-1;
        }
     }
   for(shift=Bars-1; shift>=0; shift--)
     {
      if(shift>=Bars-ExtDepth) ExtMapBuffer[shift]=0.0;
      else
        {
         res=ExtMapBuffer2[shift];
         if(res!=0.0) ExtMapBuffer2[shift]=res;
        }
     }
  }
//+------------------------------------------------------------------+
Comments