#4X TrendLine 8B
Download script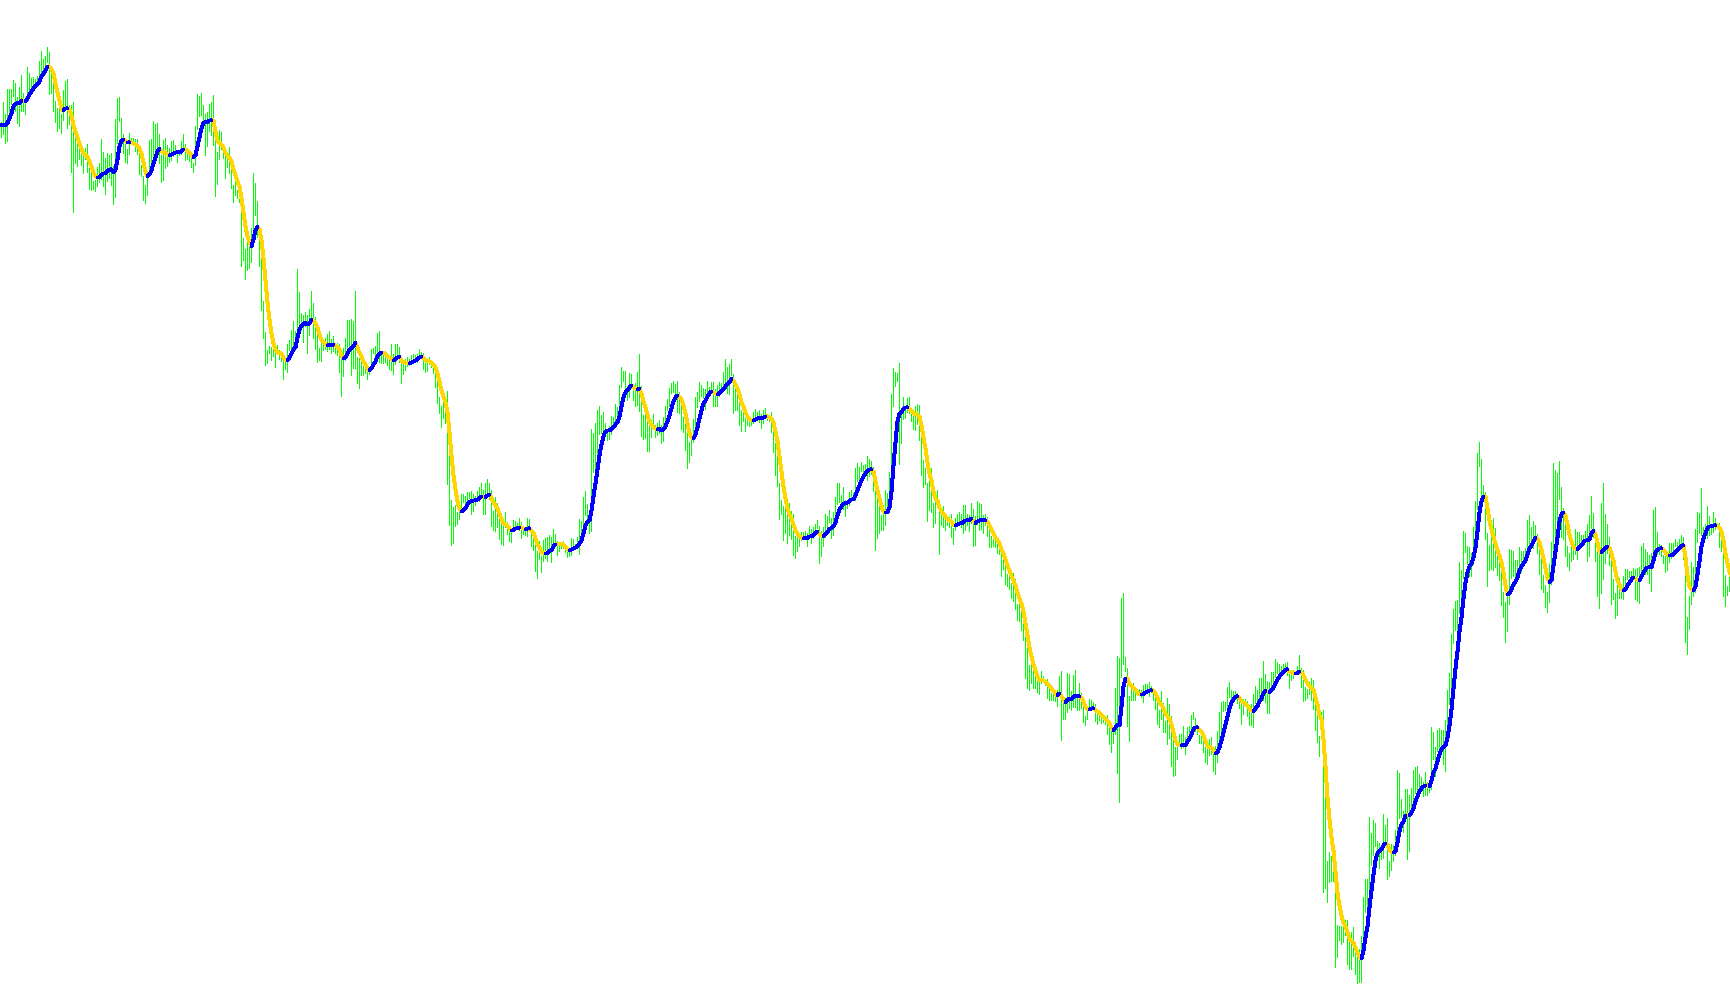
This tool is designed to provide a visual representation of market momentum by highlighting specific turning points in price trends. It simplifies complex price movements into clear, actionable signals on your trading chart.
Core Logic Overview
The indicator operates by first calculating a smoothed average of the market price over a specific timeframe (defined by the "PeriodX" setting). By using a weighted moving average, the script filters out minor market "noise," allowing it to focus on the underlying trend of the asset.
How it Identifies Trends
Once the smoothed trend line is established, the logic performs a continuous comparison between the current value and the preceding value in the sequence:
- Trend Detection: The script monitors whether the smoothed line is moving upward or downward.
- Peak and Trough Identification: Instead of drawing a continuous line that covers every price movement, the script specifically identifies the "hinge points"—the exact moments where the trend shifts direction.
- Visual Signaling:
- When the trend transitions from upward to downward, it marks the peak.
- When the trend transitions from downward to upward, it marks the trough.
User Experience on the Chart
The result is a clean visual interface where the market's direction is highlighted by distinct markers. Rather than overwhelming you with data, the indicator eliminates the intermediate movements and focuses exclusively on the significant structural changes in price. This allows traders to quickly identify potential reversal points and see the "flow" of the market more clearly at a glance.
//+------------------------------------------------------------------+
// #4X TrendLine 8B           \¦/
// Knowledge of the ancients (ò ó)
//______________________o0o___(_)___o0o_____
//___¦Xard777¦_____¦_____¦_____¦_____¦_2009_¦
//+------------------------------------------------------------------+
#property indicator_chart_window
//+------------------------------------------------------------------+
#property indicator_buffers 2
#property indicator_color1 Red
#property indicator_color2 Lime
#property indicator_width1 4
#property indicator_width2 4

double buf0[], buf1[], buf2[];
extern int PeriodX = 8;

int init() {
   IndicatorBuffers(3);
   SetIndexBuffer(0, buf0);
   SetIndexBuffer(1, buf1);
   SetIndexBuffer(2, buf2);
   SetIndexStyle(0, DRAW_LINE,0,4);
   SetIndexStyle(1, DRAW_LINE,0,4);
   return (0);
}

int start() {
   for (int X4 = Bars - 10; X4 >= 0; X4--) buf2[X4] = iMA(NULL, 0, PeriodX, 0, MODE_LWMA, PRICE_MEDIAN, X4);
   for (int X8 = Bars - 10; X8 >= 0; X8--) {
      buf0[X8] = buf2[X8]; buf1[X8] = buf2[X8];
      if (buf2[X8] > buf2[X8 + 1]) {
         buf0[X8] = EMPTY_VALUE; buf1[X8 + 1] = buf2[X8 + 1];
      } else {
         if (buf2[X8] < buf2[X8 + 1]) {
            buf1[X8] = EMPTY_VALUE; buf0[X8 + 1] = buf2[X8 + 1];
         }
      }
   }
   return (0);
}
//--------------------------------------------Xard@hotmail.co.uk-----+
Comments