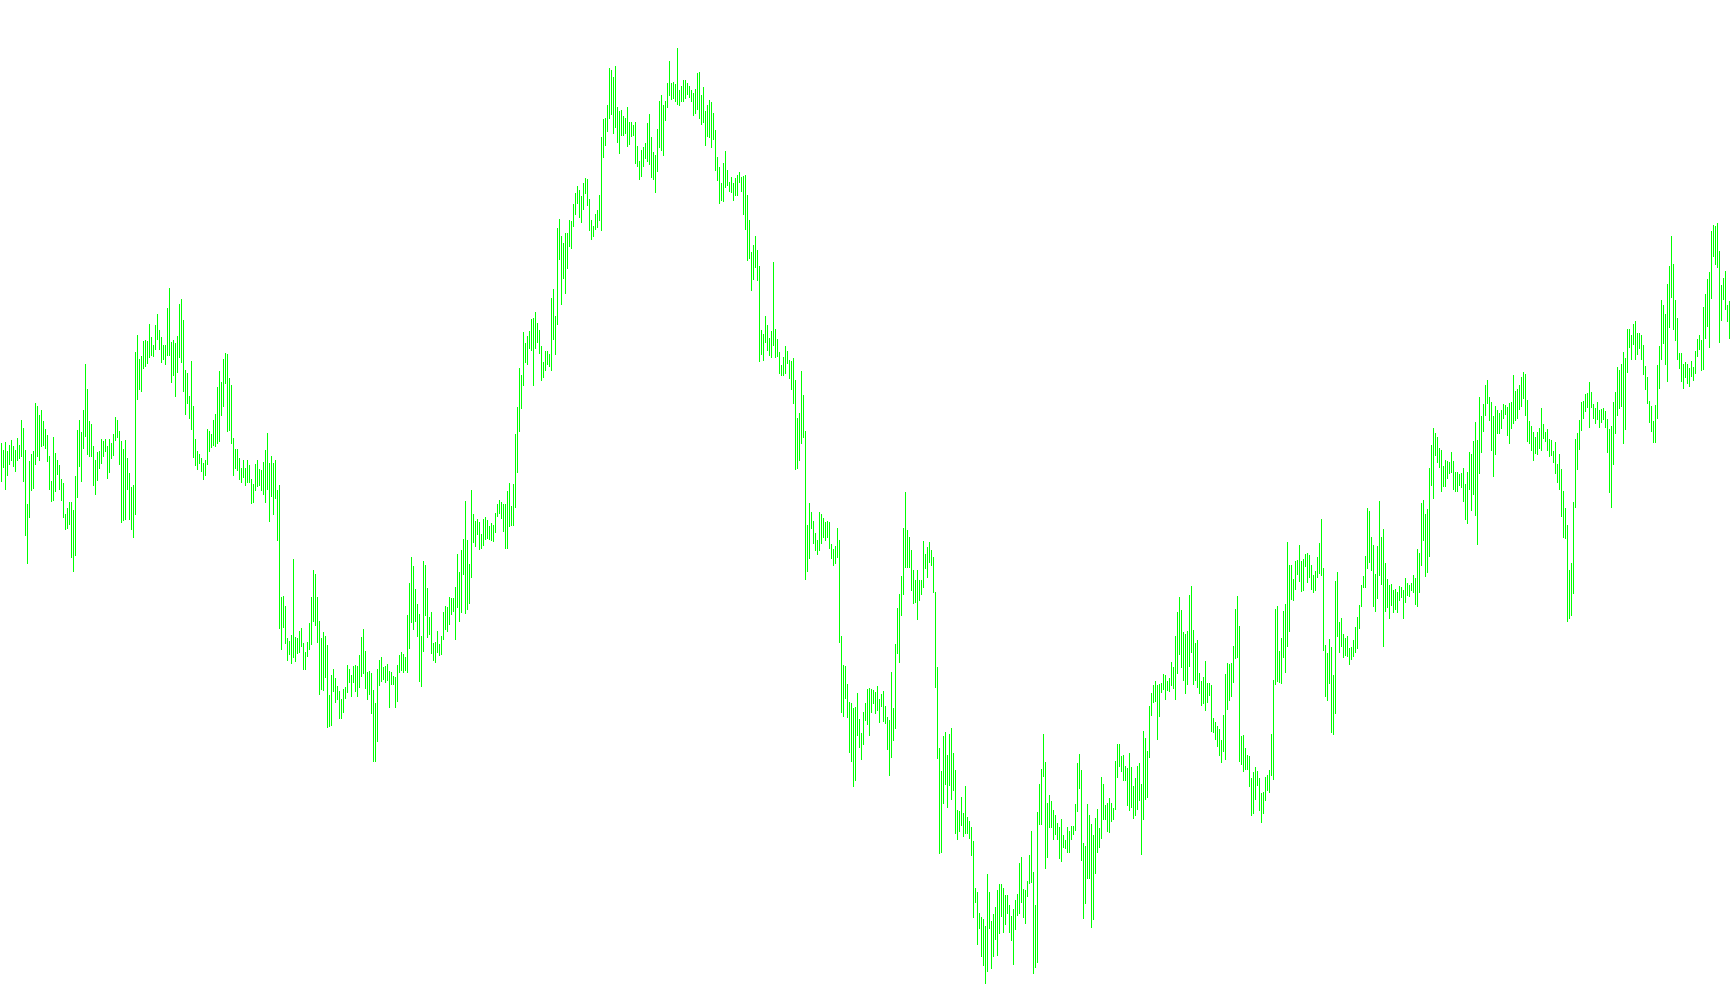
This script is a visual charting tool designed to help traders analyze price trends by overlaying multiple Moving Averages (MAs) simultaneously on a single financial chart. Rather than relying on just one average, it provides a comprehensive "gauge" of the market's momentum across different time horizons.
Core Functionality
The primary objective of this tool is to transform raw price data into seven distinct trend lines. Each line represents a Simple Moving Average (SMA) calculated based on the closing prices of the assets. By looking at these lines together, traders can get a clearer picture of market health than they would from a single indicator.
How it Works
- Multi-Layered Timeframes: The script calculates seven different averages at once. These range from short-term periods (like 21 and 34) to significantly longer-term periods (reaching up to 233).
- Visual Trend Analysis: Because each moving average covers a different amount of historical data, the lines react differently to market volatility. Short-term lines follow the price closely, while the longer-term lines provide a "smoothed" view of the overarching trend.
- Concurrent Monitoring: By plotting all seven lines on the screen at once, the tool allows you to see where different timeframes agree or disagree. For example, if the shorter lines are moving up while the longest lines remain flat, it may signal a minor price fluctuation within a larger, stagnant trend.
Key Features for the User
- Customizable Periods: The script allows users to define exactly how many bars each of the seven averages should consider, making it adaptable to different trading styles.
- Visual Clarity: Each average is assigned a unique color and can be adjusted in width, ensuring that the chart remains readable and organized even with multiple lines active.
- Smart Rendering: The tool includes logic to determine how far back on the chart the history should be drawn, ensuring the platform remains performant while providing enough data for meaningful analysis.
In summary, this script acts as a visual roadmap. It simplifies complex price movements into a series of colored trends, helping traders identify support/resistance levels and gauge whether the market's current direction is supported by both immediate momentum and long-term history.
//+------------------------------------------------------------------+
//|                                           _i_FXGaugeMAs_lite.mq4 |
//|                                     Copyright © 2007, Doji Starr |
//|                                                                  |
//+------------------------------------------------------------------+
#property copyright "Copyright © 2007, Doji Starr"

#property indicator_chart_window
#property indicator_buffers 7
#property indicator_color1 Lime
#property indicator_color2 Brown
#property indicator_color3 Magenta
#property indicator_color4 DarkSlateGray
#property indicator_color5 Yellow
#property indicator_color6 LightSlateGray
#property indicator_color7 White


// input params
extern int MA_Period1 = 21;
extern int MA_Period2 = 34;
extern int MA_Period3 = 55;
extern int MA_Period4 = 75;
extern int MA_Period5 = 100;
extern int MA_Period6 = 144;
extern int MA_Period7 = 233;
extern int ShowBars   = 10000;
extern int LineWidth  = 1;

// vars
int counted_bars, startBar, bar, i, goober;

// buffers
double buf_1[], buf_2[], buf_3[], buf_4[], buf_5[], buf_6[], buf_7[];


//+------------------------------------------------------------------+
//| Custom indicator initialization function                         |
//+------------------------------------------------------------------+
int init()
{

    IndicatorBuffers(7);

    SetIndexBuffer(0, buf_1);
    SetIndexEmptyValue(0,EMPTY_VALUE);
    SetIndexDrawBegin(0,MA_Period7);
    SetIndexStyle(0, DRAW_LINE, STYLE_SOLID, LineWidth);
    SetIndexLabel(0, " MA 1 ( "+MA_Period1+" )");

    SetIndexBuffer(1, buf_2);
    SetIndexEmptyValue(1,EMPTY_VALUE);
    SetIndexDrawBegin(1,MA_Period7);
    SetIndexStyle(1, DRAW_LINE, STYLE_SOLID, LineWidth);
    SetIndexLabel(1, " MA 2 ( "+MA_Period2+" )");

    SetIndexBuffer(2, buf_3);
    SetIndexEmptyValue(2,EMPTY_VALUE);
    SetIndexDrawBegin(2,MA_Period7);
    SetIndexStyle(2, DRAW_LINE, STYLE_SOLID, LineWidth);
    SetIndexLabel(2, " MA 3 ( "+MA_Period3+" )");

    SetIndexBuffer(3, buf_4);
    SetIndexEmptyValue(3,EMPTY_VALUE);
    SetIndexDrawBegin(3,MA_Period7);
    SetIndexStyle(3, DRAW_LINE, STYLE_SOLID, LineWidth);
    SetIndexLabel(3, " MA 4 ( "+MA_Period4+" )");

    SetIndexBuffer(4, buf_5);
    SetIndexEmptyValue(4,EMPTY_VALUE);
    SetIndexDrawBegin(4,MA_Period7);
    SetIndexStyle(4, DRAW_LINE, STYLE_SOLID, LineWidth);
    SetIndexLabel(4, " MA 5 ( "+MA_Period5+" )");

    SetIndexBuffer(5, buf_6);
    SetIndexEmptyValue(5,EMPTY_VALUE);
    SetIndexDrawBegin(5,MA_Period7);
    SetIndexStyle(5, DRAW_LINE, STYLE_SOLID, LineWidth);
    SetIndexLabel(5, " MA 6 ( "+MA_Period6+" )");

    SetIndexBuffer(6, buf_7);
    SetIndexEmptyValue(6,EMPTY_VALUE);
    SetIndexDrawBegin(6,MA_Period7);
    SetIndexStyle(6, DRAW_LINE, STYLE_SOLID, LineWidth);
    SetIndexLabel(6, " MA 7 ( "+MA_Period7+" )");

    return(0);
}

//+------------------------------------------------------------------+
//| Custom indicator deinitialization function                       |
//+------------------------------------------------------------------+
int deinit()
{
    return(0);
}

//+------------------------------------------------------------------+
//| Custom indicator iteration function                              |
//+------------------------------------------------------------------+
int start()
{

    startBar = ShowBars;

    if (startBar > Bars) { startBar = Bars-1; }

    if (startBar < MA_Period7*2 && goober < Time[0]) { Alert(" Increase ShowBars To At Least "+(MA_Period7*2+1)+" "); goober = Time[0]; }

    for (bar=0; bar<startBar; bar++)
    {
        buf_1[bar] = iMA(NULL, 0, MA_Period1, 0, MODE_SMA, PRICE_CLOSE, bar);
        buf_2[bar] = iMA(NULL, 0, MA_Period2, 0, MODE_SMA, PRICE_CLOSE, bar);
        buf_3[bar] = iMA(NULL, 0, MA_Period3, 0, MODE_SMA, PRICE_CLOSE, bar);
        buf_4[bar] = iMA(NULL, 0, MA_Period4, 0, MODE_SMA, PRICE_CLOSE, bar);
        buf_5[bar] = iMA(NULL, 0, MA_Period5, 0, MODE_SMA, PRICE_CLOSE, bar);
        buf_6[bar] = iMA(NULL, 0, MA_Period6, 0, MODE_SMA, PRICE_CLOSE, bar);
        buf_7[bar] = iMA(NULL, 0, MA_Period7, 0, MODE_SMA, PRICE_CLOSE, bar);
    }

    return(0);
}
Comments