_i_FXGaugeMAs_lite2
Download script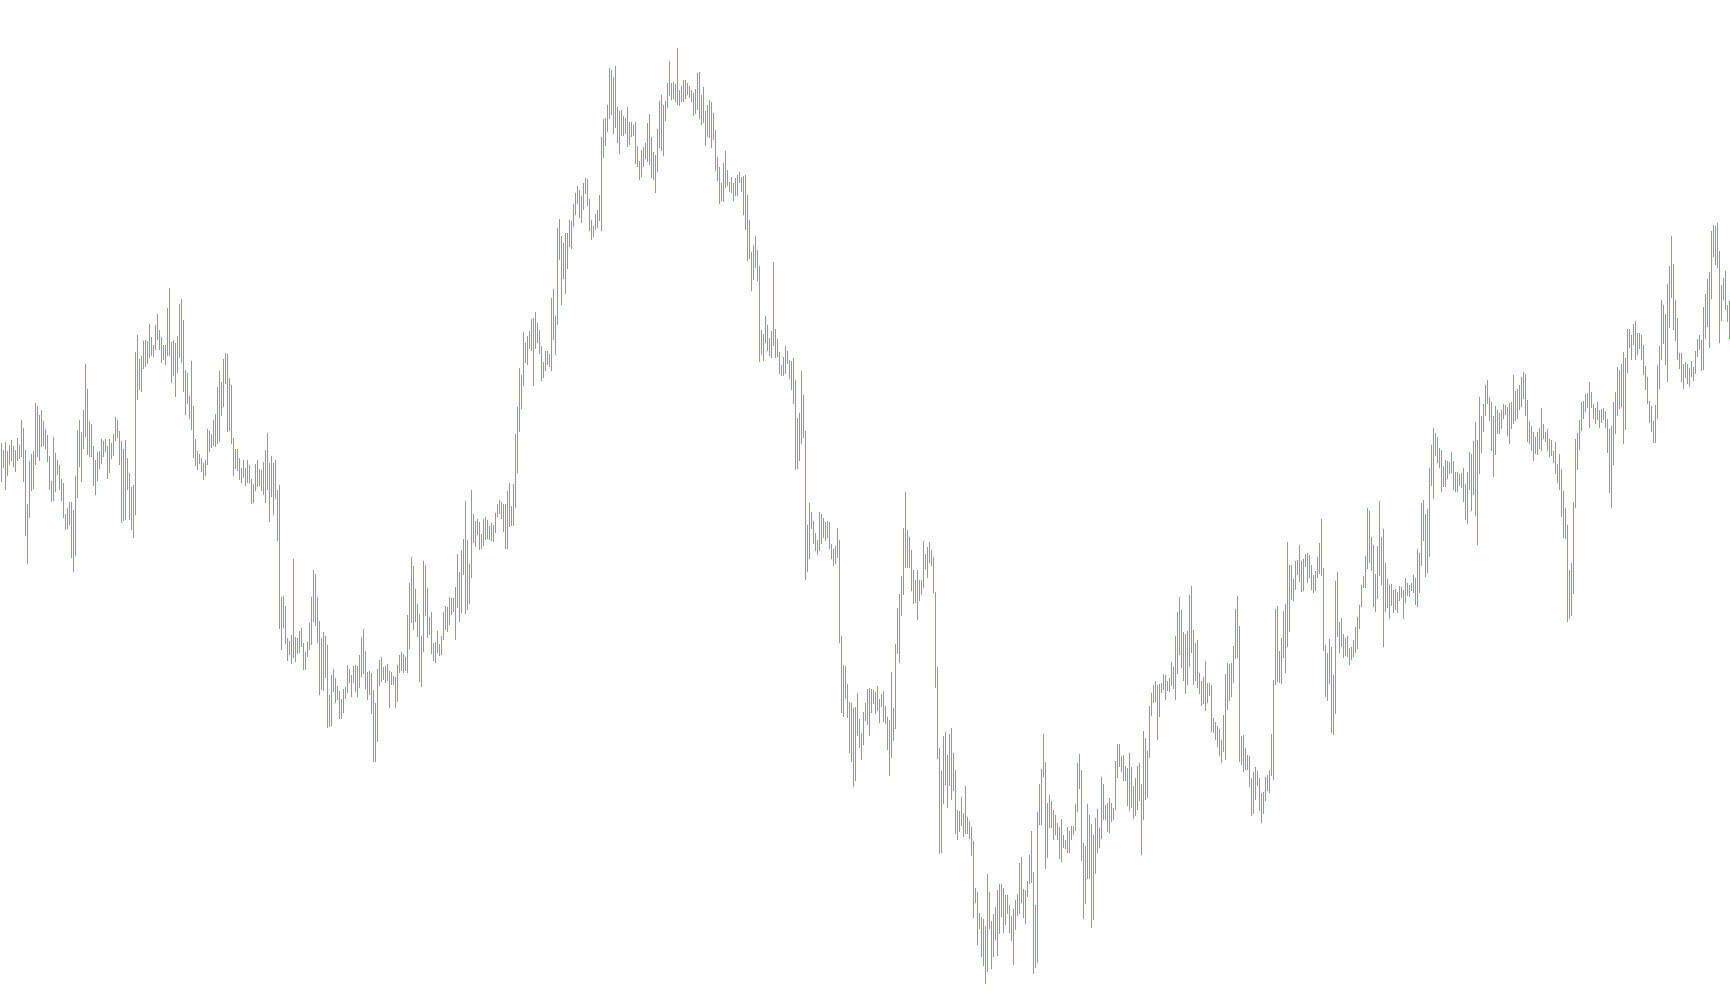
This script is designed as a visual trading tool for the MetaTrader platform that helps traders track long-term market trends by overlaying multiple Moving Averages (MAs) on a single chart.
Core Functionality
The primary purpose of this tool is to provide a comprehensive "gauge" of price momentum. Instead of showing just one average, it calculates and plots seven different moving averages simultaneously. By using varying time periods for each line, the script allows you to see a layered perspective of the market:
- Short-term trends: Captured by the faster-moving lines (smaller periods).
- Medium-term trends: Shown by the mid-range lines.
- Long-term trends: Identified by the slower, smoother lines (larger periods).
How it Works
The script operates on a "Simple Moving Average" (SMA) logic based on the closing price of every candle. It automatically calculates these averages across a specific historical range—set by the user—and draws them as distinct colored lines on your chart.
When the market is in a strong trend, these lines will typically cluster together or spread out in a specific direction. Traders can use the relationship between these seven lines to identify support levels, resistance zones, and shifts in momentum that might not be visible when looking at the price alone.
Key Features
- Multi-Layered Analysis: By plotting seven different periods at once (ranging from 21 to 233 by default), it creates a visual "web" of market history.
- Customizable Visibility: The tool includes a setting to determine how many historical bars are displayed on the screen, ensuring that your chart remains clean and focused on relevant data.
- Visual Clarity: Each moving average is assigned a unique color and label, making it easy to distinguish between the different timeframes at a glance.
- Safety Check: The script includes a built-in alert system that notifies you if your display settings are too small to properly calculate the longest moving average, ensuring that the data you see is accurate and complete.
//+------------------------------------------------------------------+
//|                                           _i_FXGaugeMAs_lite.mq4 |
//|                                     Copyright © 2007, Doji Starr |
//|                                                                  |
//+------------------------------------------------------------------+
#property copyright "Copyright © 2007, Doji Starr"

#property indicator_chart_window
#property indicator_buffers 7
#property indicator_color1 Lime
#property indicator_color2 Red
#property indicator_color3 Magenta
#property indicator_color4 DarkSlateGray
#property indicator_color5 Yellow
#property indicator_color6 LightSlateGray
#property indicator_color7 White


// input params
extern int MA_Period1 = 21;
extern int MA_Period2 = 34;
extern int MA_Period3 = 55;
extern int MA_Period4 = 75;
extern int MA_Period5 = 100;
extern int MA_Period6 = 144;
extern int MA_Period7 = 233;
extern int ShowBars   = 3000;
extern int LineWidth  = 1;

// vars
int counted_bars, startBar, bar, i, goober;

// buffers
double buf_1[], buf_2[], buf_3[], buf_4[], buf_5[], buf_6[], buf_7[];


//+------------------------------------------------------------------+
//| Custom indicator initialization function                         |
//+------------------------------------------------------------------+
int init()
{

    IndicatorBuffers(7);

    SetIndexBuffer(0, buf_1);
    SetIndexEmptyValue(0,EMPTY_VALUE);
    SetIndexDrawBegin(0,MA_Period7);
    SetIndexStyle(0, DRAW_LINE, STYLE_SOLID, LineWidth);
    SetIndexLabel(0, " MA 1 ( "+MA_Period1+" )");

    SetIndexBuffer(1, buf_2);
    SetIndexEmptyValue(1,EMPTY_VALUE);
    SetIndexDrawBegin(1,MA_Period7);
    SetIndexStyle(1, DRAW_LINE, STYLE_SOLID, LineWidth);
    SetIndexLabel(1, " MA 2 ( "+MA_Period2+" )");

    SetIndexBuffer(2, buf_3);
    SetIndexEmptyValue(2,EMPTY_VALUE);
    SetIndexDrawBegin(2,MA_Period7);
    SetIndexStyle(2, DRAW_LINE, STYLE_SOLID, LineWidth);
    SetIndexLabel(2, " MA 3 ( "+MA_Period3+" )");

    SetIndexBuffer(3, buf_4);
    SetIndexEmptyValue(3,EMPTY_VALUE);
    SetIndexDrawBegin(3,MA_Period7);
    SetIndexStyle(3, DRAW_LINE, STYLE_SOLID, LineWidth);
    SetIndexLabel(3, " MA 4 ( "+MA_Period4+" )");

    SetIndexBuffer(4, buf_5);
    SetIndexEmptyValue(4,EMPTY_VALUE);
    SetIndexDrawBegin(4,MA_Period7);
    SetIndexStyle(4, DRAW_LINE, STYLE_SOLID, LineWidth);
    SetIndexLabel(4, " MA 5 ( "+MA_Period5+" )");

    SetIndexBuffer(5, buf_6);
    SetIndexEmptyValue(5,EMPTY_VALUE);
    SetIndexDrawBegin(5,MA_Period7);
    SetIndexStyle(5, DRAW_LINE, STYLE_SOLID, LineWidth);
    SetIndexLabel(5, " MA 6 ( "+MA_Period6+" )");

    SetIndexBuffer(6, buf_7);
    SetIndexEmptyValue(6,EMPTY_VALUE);
    SetIndexDrawBegin(6,MA_Period7);
    SetIndexStyle(6, DRAW_LINE, STYLE_SOLID, LineWidth);
    SetIndexLabel(6, " MA 7 ( "+MA_Period7+" )");

    return(0);
}

//+------------------------------------------------------------------+
//| Custom indicator deinitialization function                       |
//+------------------------------------------------------------------+
int deinit()
{
    return(0);
}

//+------------------------------------------------------------------+
//| Custom indicator iteration function                              |
//+------------------------------------------------------------------+
int start()
{

    startBar = ShowBars;

    if (startBar > Bars) { startBar = Bars-1; }

    if (startBar < MA_Period7*2 && goober < Time[0]) { Alert(" Increase ShowBars To At Least "+(MA_Period7*2+1)+" "); goober = Time[0]; }

    for (bar=0; bar<startBar; bar++)
    {
        buf_1[bar] = iMA(NULL, 0, MA_Period1, 0, MODE_SMA, PRICE_CLOSE, bar);
        buf_2[bar] = iMA(NULL, 0, MA_Period2, 0, MODE_SMA, PRICE_CLOSE, bar);
        buf_3[bar] = iMA(NULL, 0, MA_Period3, 0, MODE_SMA, PRICE_CLOSE, bar);
        buf_4[bar] = iMA(NULL, 0, MA_Period4, 0, MODE_SMA, PRICE_CLOSE, bar);
        buf_5[bar] = iMA(NULL, 0, MA_Period5, 0, MODE_SMA, PRICE_CLOSE, bar);
        buf_6[bar] = iMA(NULL, 0, MA_Period6, 0, MODE_SMA, PRICE_CLOSE, bar);
        buf_7[bar] = iMA(NULL, 0, MA_Period7, 0, MODE_SMA, PRICE_CLOSE, bar);
    }

    return(0);
}
Comments