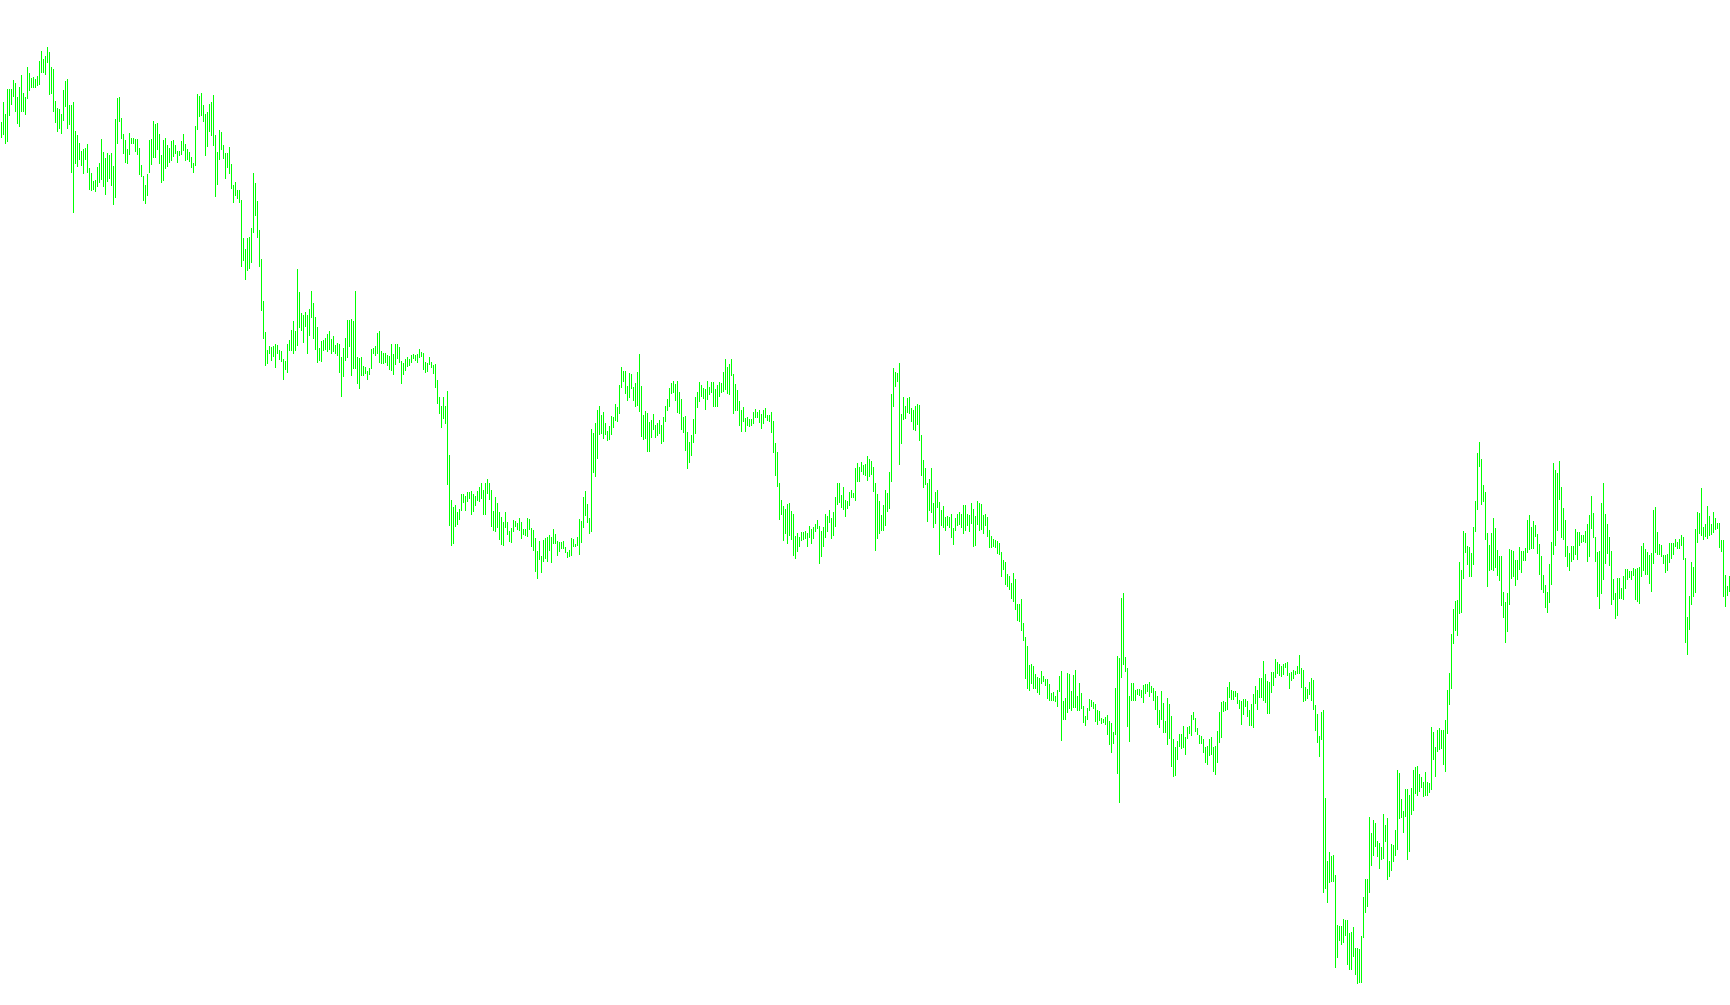
This script is designed to provide traders with a multi-layered perspective on market trends by analyzing price data across different timeframes simultaneously. Instead of looking at the current chart in isolation, the logic works by "layering" information from three distinct periods—5 minutes, 1 hour, and 4 hours—into a single visual display.
How the Logic Works
1. Multi-Timeframe Synchronization The core functionality of this script is its ability to look ahead and behind across different time intervals. It takes the current time of your active chart and identifies the corresponding price points on three specific higher timeframes:
- Short-term (5 Minutes)
- Medium-term (1 Hour)
- Long-term (4 Hours)
2. Moving Average Analysis For each of these three timeframes, the script calculates several "Simple Moving Averages" (SMAs). Specifically, it looks at averages based on 5, 10, and 15 periods for each timeframe. These moving averages serve as smoothed representations of price action, helping to filter out "noise" and identify the true direction of the market.
3. Data Aggregation and Visualization The script processes this massive amount of data (calculating nine different average values across three timeframes) and simplifies it into a visual output. It focuses on capturing specific trends from these calculations to plot three distinct lines on your screen.
By doing this, the tool allows you to see how short-term price momentum relates to broader market trends. Rather than just seeing what is happening right now, the logic helps you visualize how current price movements align with the "bigger picture" of the hourly and four-hourly trends.
Key Benefits for the User
- Contextual Awareness: It allows you to see if a small, fast move in the 5-minute window is supported by the much larger, slower trends of the 1-hour or 4-hour charts.
- Trend Smoothing: By using multiple moving averages across different scales, the script helps identify established trends more clearly than looking at raw price bars alone.
- Unified View: It consolidates complex multi-timeframe calculations into a single window, saving the user from having to constantly flip between different tabs or charts to verify market sentiment.
//+------------------------------------------------------------------+
//|                                                   Better_MA.mq4  |
//|                      Copyright © 2007, MetaQuotes Software Corp. |
//|                                        http://www.metaquotes.net |
//+------------------------------------------------------------------+
#property copyright "Copyright © 2007, MetaQuotes Software Corp."
#property link      "http://www.metaquotes.net"

#property indicator_separate_window
#property indicator_buffers 3
#property indicator_color1 Lime
#property indicator_color2 Aqua
#property indicator_color3 White


extern int NrBars=1000;

string SymbolName;
int PeriodMinutes1=0;
int PeriodMinutes5=PERIOD_M5;
int PeriodMinutes60=PERIOD_H1;
int PeriodMinutes240=PERIOD_H4;


//---- buffers
double VolBuffer1[];
double VolBuffer2[];
double VolBuffer3[];
double x0,x1,x2,x3,x4,x5,x6,x7,x8,x9;

//+------------------------------------------------------------------+
//| Custom indicator initialization function                         |
//|------------------------------------------------------------------|

int init()
  {


    SymbolName = Symbol();


   IndicatorBuffers(3);

   SetIndexStyle(0,DRAW_LINE,0,1);
   SetIndexBuffer(0, VolBuffer1);

   SetIndexEmptyValue(0,EMPTY_VALUE);

   SetIndexStyle(1,DRAW_LINE,0,1);
   SetIndexBuffer(1, VolBuffer2);

   SetIndexEmptyValue(1,EMPTY_VALUE);

   SetIndexStyle(2,DRAW_LINE,0,1);
   SetIndexBuffer(2, VolBuffer3);

   SetIndexEmptyValue(2,EMPTY_VALUE);

   return(0);
  }


//+------------------------------------------------------------------+
//| Custor indicator deinitialization function                       |
//+------------------------------------------------------------------+
int deinit()
  {

  }

//+------------------------------------------------------------------+
//| Custom indicator iteration function                              |
//+------------------------------------------------------------------+
int start()
  {

   for (int i=NrBars-1;i>=0;i--)
      {
      datetime time1=iTime(SymbolName,PeriodMinutes1,i);

      int b5=iBarShift(SymbolName,PeriodMinutes5,time1,true);
      int b60=iBarShift(SymbolName,PeriodMinutes60,time1,true);
      int b240=iBarShift(SymbolName,PeriodMinutes240,time1,true);


      if(b5>=0)
      {
        x0=iClose(SymbolName,PeriodMinutes5,b5);
        x1=iMA(SymbolName,PeriodMinutes5,5,0,MODE_SMA,PRICE_CLOSE,b5);
        x2=iMA(SymbolName,PeriodMinutes5,10,0,MODE_SMA,PRICE_CLOSE,b5);
        x3=iMA(SymbolName,PeriodMinutes5,15,0,MODE_SMA,PRICE_CLOSE,b5);
      }
      if(b60>=0)
      {
        x4=iMA(SymbolName,PeriodMinutes60,5,0,MODE_SMA,PRICE_CLOSE,b60);
        x5=iMA(SymbolName,PeriodMinutes60,10,0,MODE_SMA,PRICE_CLOSE,b60);
        x6=iMA(SymbolName,PeriodMinutes60,15,0,MODE_SMA,PRICE_CLOSE,b60);
      }
      if(b240>=0)
      {
        x7=iMA(SymbolName,PeriodMinutes240,5,0,MODE_SMA,PRICE_CLOSE,b240);
        x8=iMA(SymbolName,PeriodMinutes240,10,0,MODE_SMA,PRICE_CLOSE,b240);
        x9=iMA(SymbolName,PeriodMinutes240,15,0,MODE_SMA,PRICE_CLOSE,b240);
      }
	  VolBuffer1[i]=x1;
 	  VolBuffer2[i]=x2;
 	  VolBuffer3[i]=x3;

  }


   return(0);
  }
//+------------------------------------------------------------------+
Comments