Vegas1HR_v2
Download script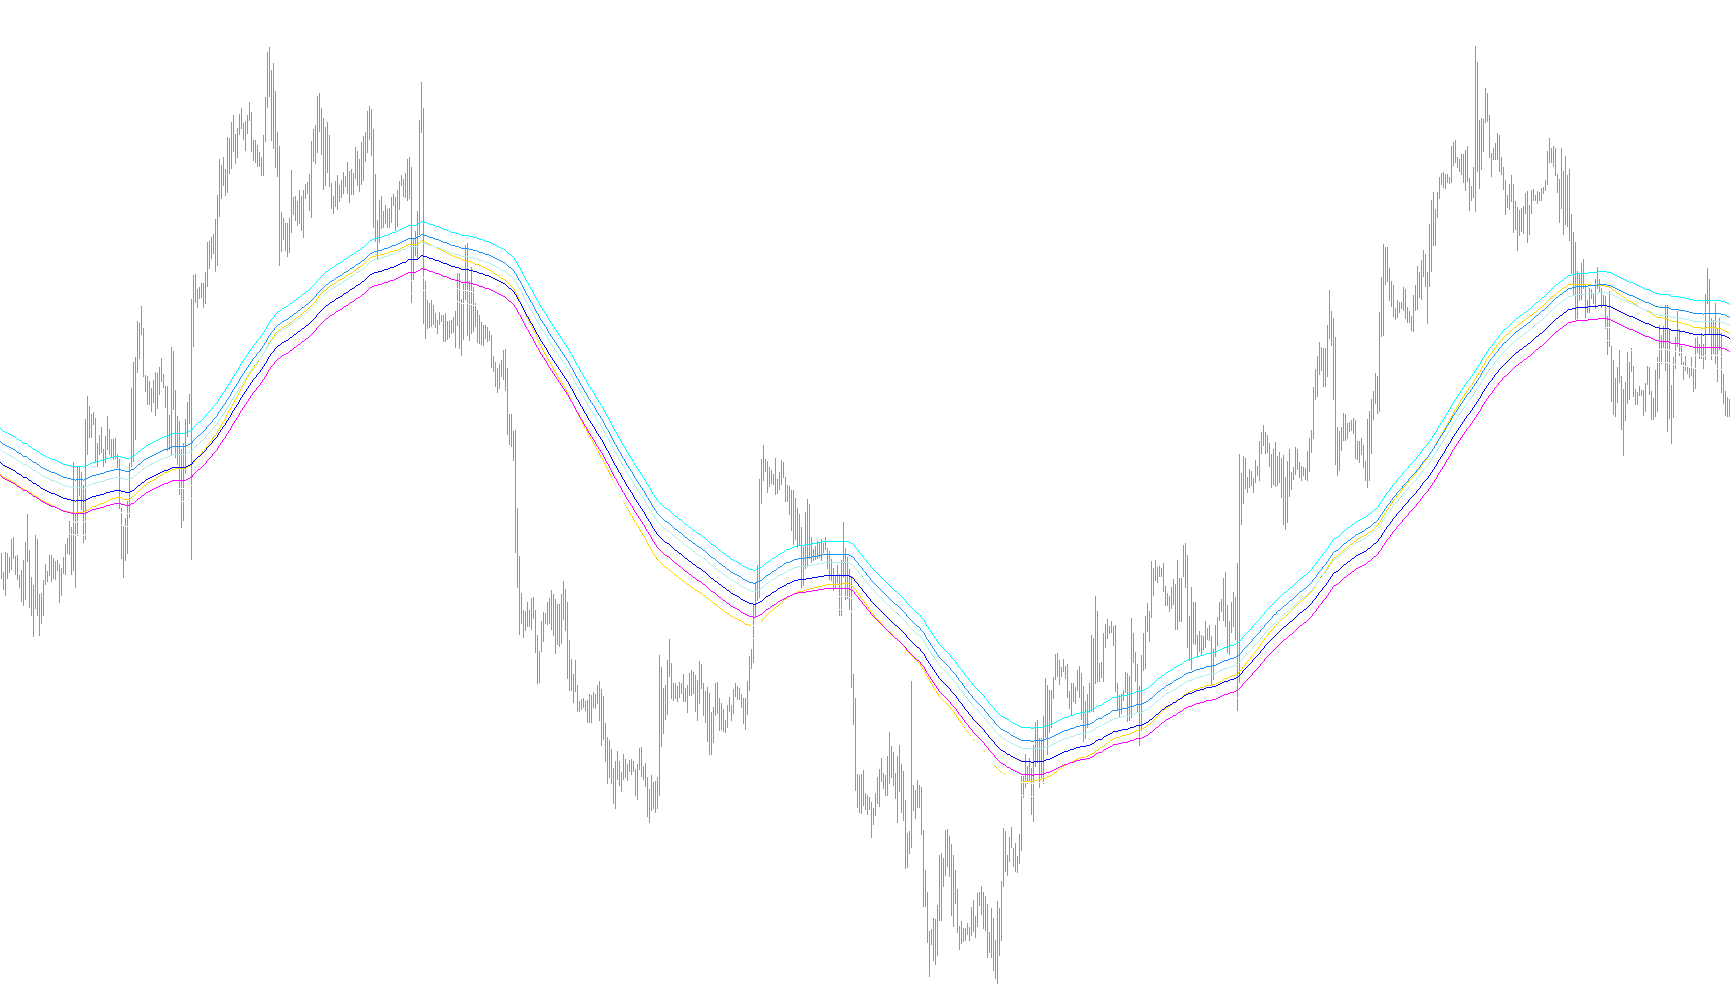
The Vegas script is a specialized technical analysis tool designed for the MetaTrader platform. Its primary purpose is to provide traders with a visual and audible framework for identifying key price levels based on moving averages and predefined risk zones.
Core Logic and Mechanics
The indicator operates by calculating two primary "baseline" moving averages: one based on 144 periods and another on 169 periods. These serve as the foundation for all other data points displayed on your chart.
Dynamic Risk Models One of the key features of this script is its ability to switch between four different "Risk Models." Depending on which model you select, the script automatically calculates a series of symmetrical support and resistance levels (zones) relative to the 169-period moving average. These models are defined by specific mathematical offsets:
- Model 1: Uses smaller, tighter offsets for high-sensitivity environments.
- Model 2: Moderate offsets for standard market conditions.
- Model 3: Wider offsets for capturing larger swings.
- Model 4: The largest offsets, designed to identify significant long-term structural boundaries.
For each model chosen, the script projects three levels above the moving average and three levels below it, creating a comprehensive map of potential interaction points where price might react or reverse.
Visual and Interactive Elements
The script enhances the trading experience in three distinct ways:
- Visual Mapping: It plots these calculated levels as lines on your chart, allowing you to see the "map" of the market at a glance. This helps in identifying where the price is currently sitting in relation to high-interest zones.
- On-Screen Data: The script provides a real-time text readout on your chart. This display shows the exact numerical values for the moving averages and all current risk levels (labeled as F+1 through F+3 and F-1 through F-3), ensuring you have precise data without having to manually calculate anything.
- Automated Alerts: To ensure you never miss a critical interaction, the script includes an automated alert system. If the current market price touches any of the calculated moving averages or any of the risk model lines, the software will trigger an audible sound notification.
Summary for the User
Essentially, this tool automates the "drawing" of key price levels based on mathematical constants. By choosing a Risk Model that fits your trading style, you can instantly see a complete landscape of potential support and resistance zones, with the system acting as a lookout to notify you whenever the market price hits one of these significant boundaries.
//+------------------------------------------------------------------+
//|                                                        Vegas.mq4 |
//|                                                           Mr.Bah |
//|                                                                  |
//+------------------------------------------------------------------+
#property copyright "Mr.Bah"
#property link      ""

#property indicator_chart_window
#property indicator_buffers 8
#property indicator_color1 Green
#property indicator_color2 Blue
#property indicator_color3 Red
#property indicator_color4 Red
#property indicator_color5 Red
#property indicator_color6 Red
#property indicator_color7 Red
#property indicator_color8 Red
//---- input parameters
extern bool Alerts = true;
extern int  RiskModel = 1;
extern int  MA1 = 144;
extern int  MA2 = 169;
//---- buffers
double ExtMapBuffer1[];
double ExtMapBuffer2[];
double ExtMapBuffer3[];
double ExtMapBuffer4[];
double ExtMapBuffer5[];
double ExtMapBuffer6[];
double ExtMapBuffer7[];
double ExtMapBuffer8[];
//+------------------------------------------------------------------+
//| Custom indicator initialization function                         |
//+------------------------------------------------------------------+
int init()
  {
//---- indicators
   SetIndexStyle(0, DRAW_LINE);
   SetIndexBuffer(0, ExtMapBuffer1);
   SetIndexStyle(1, DRAW_LINE);
   SetIndexBuffer(1, ExtMapBuffer2);
   SetIndexStyle(2, DRAW_LINE);
   SetIndexBuffer(2, ExtMapBuffer3);
   SetIndexStyle(3, DRAW_LINE);
   SetIndexBuffer(3, ExtMapBuffer4);
   SetIndexStyle(4, DRAW_LINE);
   SetIndexBuffer(4, ExtMapBuffer5);
   SetIndexStyle(5, DRAW_LINE);
   SetIndexBuffer(5, ExtMapBuffer6);
   SetIndexStyle(6, DRAW_LINE);
   SetIndexBuffer(6, ExtMapBuffer7);
   SetIndexStyle(7, DRAW_LINE);
   SetIndexBuffer(7, ExtMapBuffer8);
//----
   return(0);
  }
//+------------------------------------------------------------------+
//| Custor indicator deinitialization function                       |
//+------------------------------------------------------------------+
int deinit()
  {
//----
   return(0);
  }
//+------------------------------------------------------------------+
//| Custom indicator iteration function                              |
//+------------------------------------------------------------------+
int start()
  {
   int limit;
   int counted_bars = IndicatorCounted();
//---- check for possible errors
   if(counted_bars < 0)
       return(-1);
//---- last counted bar will be recounted
   if(counted_bars > 0)
       counted_bars--;
   limit = Bars - counted_bars;
//---- main loop
   for(int i = 0; i < limit; i++)
     {
       //---- ma_shift set to 0 because SetIndexShift called abowe
       ExtMapBuffer1[i] = iMA(NULL, 0, 144, 0, MODE_EMA, PRICE_CLOSE, i);
       ExtMapBuffer2[i] = iMA(NULL, 0, 169, 0, MODE_EMA, PRICE_CLOSE, i);
       //Model #1 34,55,89
       if(RiskModel == 1)
         {
           ExtMapBuffer3[i] = ExtMapBuffer2[i] + 34*Point;
           ExtMapBuffer4[i] = ExtMapBuffer2[i] + 55*Point;
           ExtMapBuffer5[i] = ExtMapBuffer2[i] + 89*Point;
           //----
           ExtMapBuffer6[i] = ExtMapBuffer2[i] - 34*Point;
           ExtMapBuffer7[i] = ExtMapBuffer2[i] - 55*Point;
           ExtMapBuffer8[i] = ExtMapBuffer2[i] - 89*Point;
         }
       //Model #2 55,89,144
       if(RiskModel == 2)
         {
           ExtMapBuffer3[i] = ExtMapBuffer2[i] + 55*Point;
           ExtMapBuffer4[i] = ExtMapBuffer2[i] + 89*Point;
           ExtMapBuffer5[i] = ExtMapBuffer2[i] + 144*Point;
           //----
           ExtMapBuffer6[i] = ExtMapBuffer2[i] - 55*Point;
           ExtMapBuffer7[i] = ExtMapBuffer2[i] - 88*Point;
           ExtMapBuffer8[i] = ExtMapBuffer2[i] - 144*Point;
         }
       //Model #3 89,144,233
       if(RiskModel == 3)
         {
           ExtMapBuffer3[i] = ExtMapBuffer2[i] + 89*Point;
           ExtMapBuffer4[i] = ExtMapBuffer2[i] + 144*Point;
           ExtMapBuffer5[i] = ExtMapBuffer2[i] + 233*Point;
           //----
           ExtMapBuffer6[i]=ExtMapBuffer2[i]-89*Point;
           ExtMapBuffer7[i]=ExtMapBuffer2[i]-144*Point;
           ExtMapBuffer8[i]=ExtMapBuffer2[i]-233*Point;
         }
       //Model #4 144,233,377
       if(RiskModel == 4)
         {
           ExtMapBuffer3[i] = ExtMapBuffer2[i] + 144*Point;
           ExtMapBuffer4[i] = ExtMapBuffer2[i] + 233*Point;
           ExtMapBuffer5[i] = ExtMapBuffer2[i] + 377*Point;
           //----
           ExtMapBuffer6[i] = ExtMapBuffer2[i] -   144*Point;
           ExtMapBuffer7[i] = ExtMapBuffer2[i] - 233*Point;
           ExtMapBuffer8[i] = ExtMapBuffer2[i] - 377*Point;
         }
       Comment("\nRISK MODEL #", RiskModel, " (1-4)\n\nEMA144 - ",
               ExtMapBuffer1[limit], "\nEMA169 - ", ExtMapBuffer2[limit],
       "\n\nF+1 - ", ExtMapBuffer3[limit], "\nF+2 - ", ExtMapBuffer4[limit],
       "\nF+3 - ", ExtMapBuffer5[limit], "\n\nF-1 - ", ExtMapBuffer6[limit],
       "\nF-2 - ", ExtMapBuffer7[limit], "\nF-3 - ", ExtMapBuffer8[limit]);
     }
//+--------------------------------------------------------------------------+
//-                          ALERTS    PlaySound("alert.wav");               -
//+--------------------------------------------------------------------------+
   if(Alerts)
     {
       if(Close[i] == ExtMapBuffer1[i] || Close[i] == ExtMapBuffer2[i])
         {
           PlaySound("alert.wav");
         }
       if(Close[i] == ExtMapBuffer3[i] || Close[i] == ExtMapBuffer4[i] ||
          Close[i] == ExtMapBuffer5[i])
         {
           PlaySound("alert.wav");
         }
       if(Close[i] == ExtMapBuffer6[i] || Close[i] == ExtMapBuffer7[i] ||
          Close[i] == ExtMapBuffer8[i])
         {
           PlaySound("alert.wav");
         }
     }
//---- done
   return(0);
  }
//+------------------------------------------------------------------+
Comments