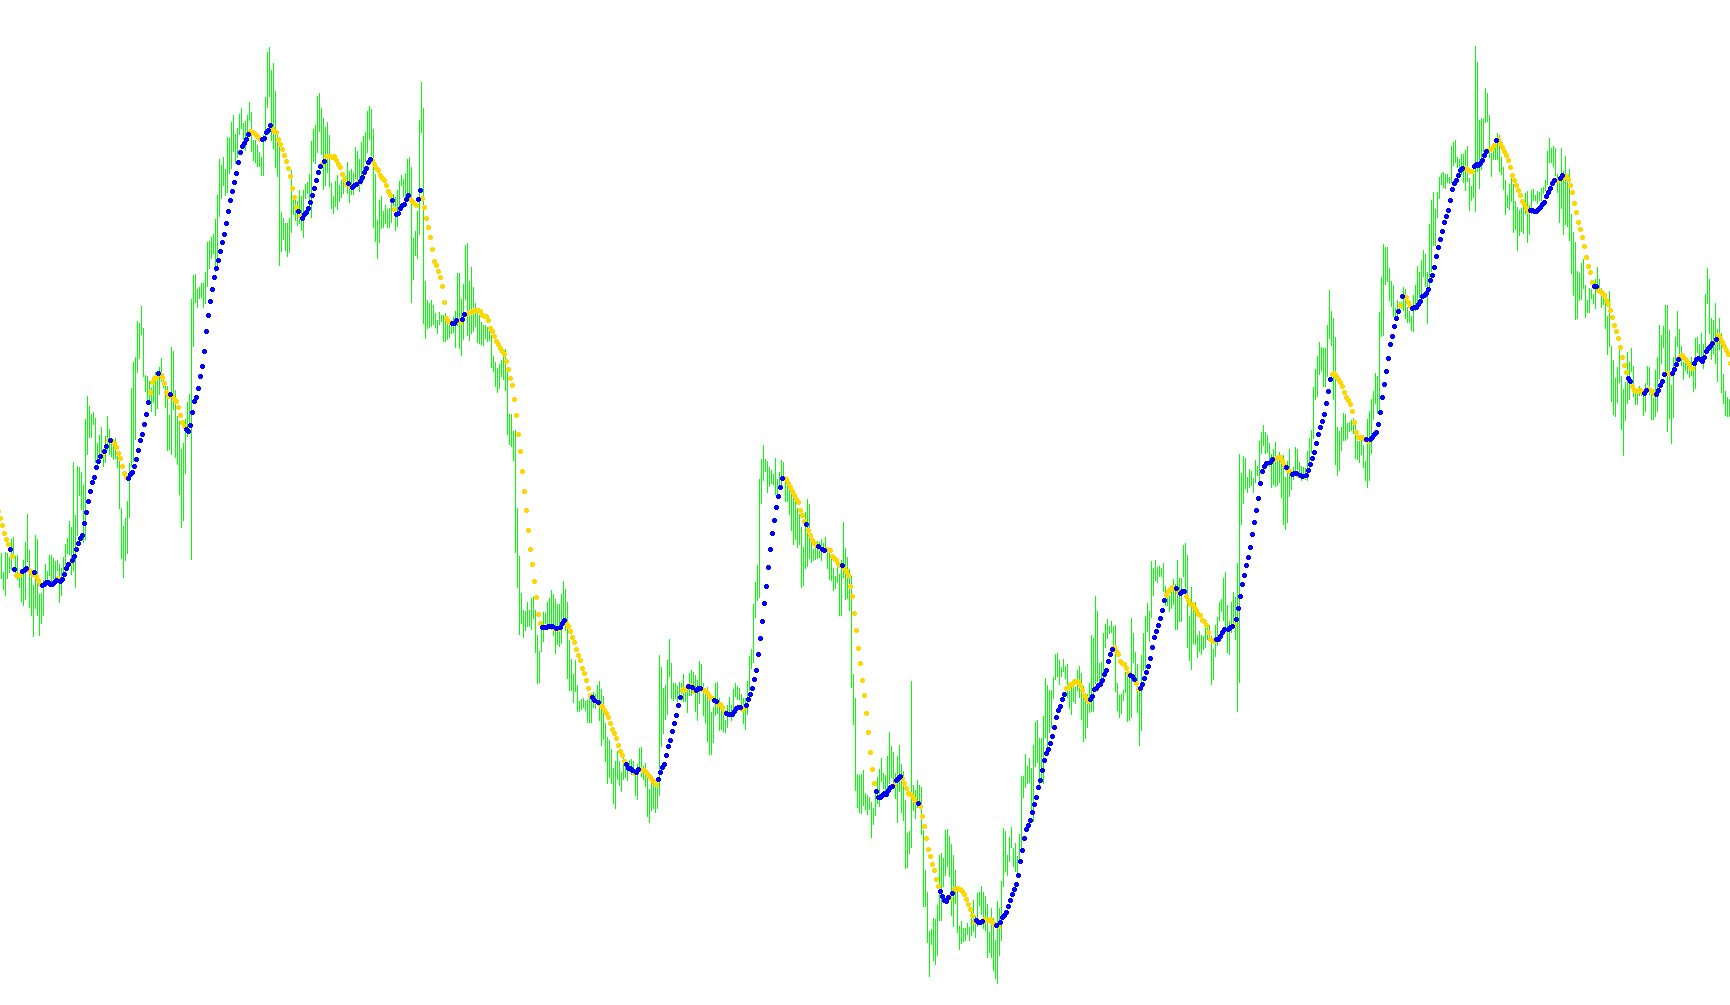
This tool is designed to provide traders with a visual representation of price trends by calculating a specific type of moving average that highlights shifts in market direction. Rather than simply showing a smooth line, it focuses on identifying the exact moments when the "momentum" of the average changes, making it easier to spot potential trend reversals or continuations.
How the Logic Works
The script operates by monitoring the closing prices of the currency pairs or assets you are trading. Here is a breakdown of its core processes:
1. Trend Calculation and Comparison The script looks at a specific number of previous price points (defined by the period) to calculate a moving average. It then compares the current moving average value against the previous one. By doing this, it determines if the trend is currently "turning."
2. Directional Signaling Instead of showing every data point as a continuous line, the logic identifies specific movements:
- If the trend shifts in one direction (e.g., from a downward trajectory to an upward one), the script marks that specific point on your chart.
- It uses two primary visual markers to distinguish between different types of trend movements, allowing you to see which "side" of the market the average is favoring at any given time.
3. Significant Movement Filtering (Volatility Check) To prevent the chart from becoming cluttered with "noise" (minor price fluctuations that don't represent a real change), the script includes a threshold check. It calculates the difference between the current price and a previous price point:
- Low Volatility: If the price movement is very small, the script remains quiet to avoid giving false signals.
- High Volatility: If the price movement exceeds a specific user-defined threshold, the script triggers a third, distinct visual marker. This tells the trader that not only has the trend changed, but it has done so with enough strength to be considered significant.
Summary for the Trader
Essentially, this tool filters out the "messy" middle of the market to highlight the "turning points." It tells you:
- Where the average is turning.
- Which direction that turn is heading.
- Whether that turn is happening with enough force to be significant or if it is just a minor price wiggle.
//+------------------------------------------------------------------+
//|                                           MultiMovingAverage.mq4 |
//+------------------------------------------------------------------+
#property copyright "Ron T"
#property link      "http://www.lightpatch.com"

#property indicator_chart_window
#property indicator_buffers 3
#property indicator_color1 Red
#property indicator_color2 White
#property indicator_color3 DeepSkyBlue

//---- buffers
double ExtMapBuffer1[];
double ExtMapBuffer2[];
double ExtMapBuffer3[];

//----
int ExtCountedBars=0;

//---- indicator parameters
extern int MA_Period=13;
extern int Plot_Character=159;
extern double indChange=0.01;


//+------------------------------------------------------------------+
//| Custom indicator initialization function                         |
//|------------------------------------------------------------------|
int init()
  {

//---- indicators

   SetIndexStyle(0,DRAW_ARROW);
   SetIndexBuffer(0, ExtMapBuffer1);
   SetIndexArrow(0,Plot_Character);

   SetIndexStyle(1,DRAW_ARROW);
   SetIndexBuffer(1, ExtMapBuffer2);
   SetIndexArrow(1,Plot_Character);

   SetIndexStyle(2,DRAW_ARROW);
   SetIndexBuffer(2, ExtMapBuffer3);
   SetIndexArrow(2,224);

   if(MA_Period<2) MA_Period=13;

   return(0);
  }


//+------------------------------------------------------------------+
//| Custor indicator deinitialization function                       |
//+------------------------------------------------------------------+
int deinit()
  {
//---- TODO: add your code here

//----
   return(0);
  }


//+------------------------------------------------------------------+
//| Custom indicator iteration function                              |
//+------------------------------------------------------------------+
int start()
  {
     double sum=0;
     double oldsum=0;
     double change=0;

     int    i;
     int pos=Bars-ExtCountedBars-1;

//---- initial accumulation
   if(pos<MA_Period) pos=MA_Period;
   for(i=1;i<MA_Period;i++,pos--)
      sum+=Close[pos];


   if(Bars<=10) return(0);
   ExtCountedBars=IndicatorCounted();

//---- check for possible errors
   if (ExtCountedBars<0) return(-1);

//---- last counted bar will be recounted
   if (ExtCountedBars>0) ExtCountedBars--;


//---- main calculation loop
   while(pos>=0)
     {
      oldsum=sum;

      // add in the leading value to make MA_Period samples
      sum+=Close[pos];

      change=MathAbs(Close[pos]-Close[pos+6]);

      if(oldsum/(MA_Period-1) > sum/MA_Period)
         {
         ExtMapBuffer1[pos]=sum/MA_Period;
         ExtMapBuffer2[pos]=0;

         if (change>indChange)
            ExtMapBuffer3[pos]=sum/MA_Period;
         else
            ExtMapBuffer3[pos]=0;
         }
         else
         {
         ExtMapBuffer1[pos]=0;
         ExtMapBuffer2[pos]=sum/MA_Period;

         if (change>indChange)
            ExtMapBuffer3[pos]=sum/MA_Period;
         else
            ExtMapBuffer3[pos]=0;
         }

      // remove the trailing period to make MA_Period-1 samples
      sum-=Close[pos+MA_Period-1];
 	   pos--;
     }

//---- zero initial bars
   if(ExtCountedBars<1)
      {
      for(i=1;i<MA_Period;i++) ExtMapBuffer1[Bars-i]=0;
      for(i=1;i<MA_Period;i++) ExtMapBuffer2[Bars-i]=0;
      for(i=1;i<MA_Period;i++) ExtMapBuffer3[Bars-i]=0;
      }

   return(0);
  }

//+------------------------------------------------------------------+
Comments