Regression_Channel_v1
Download script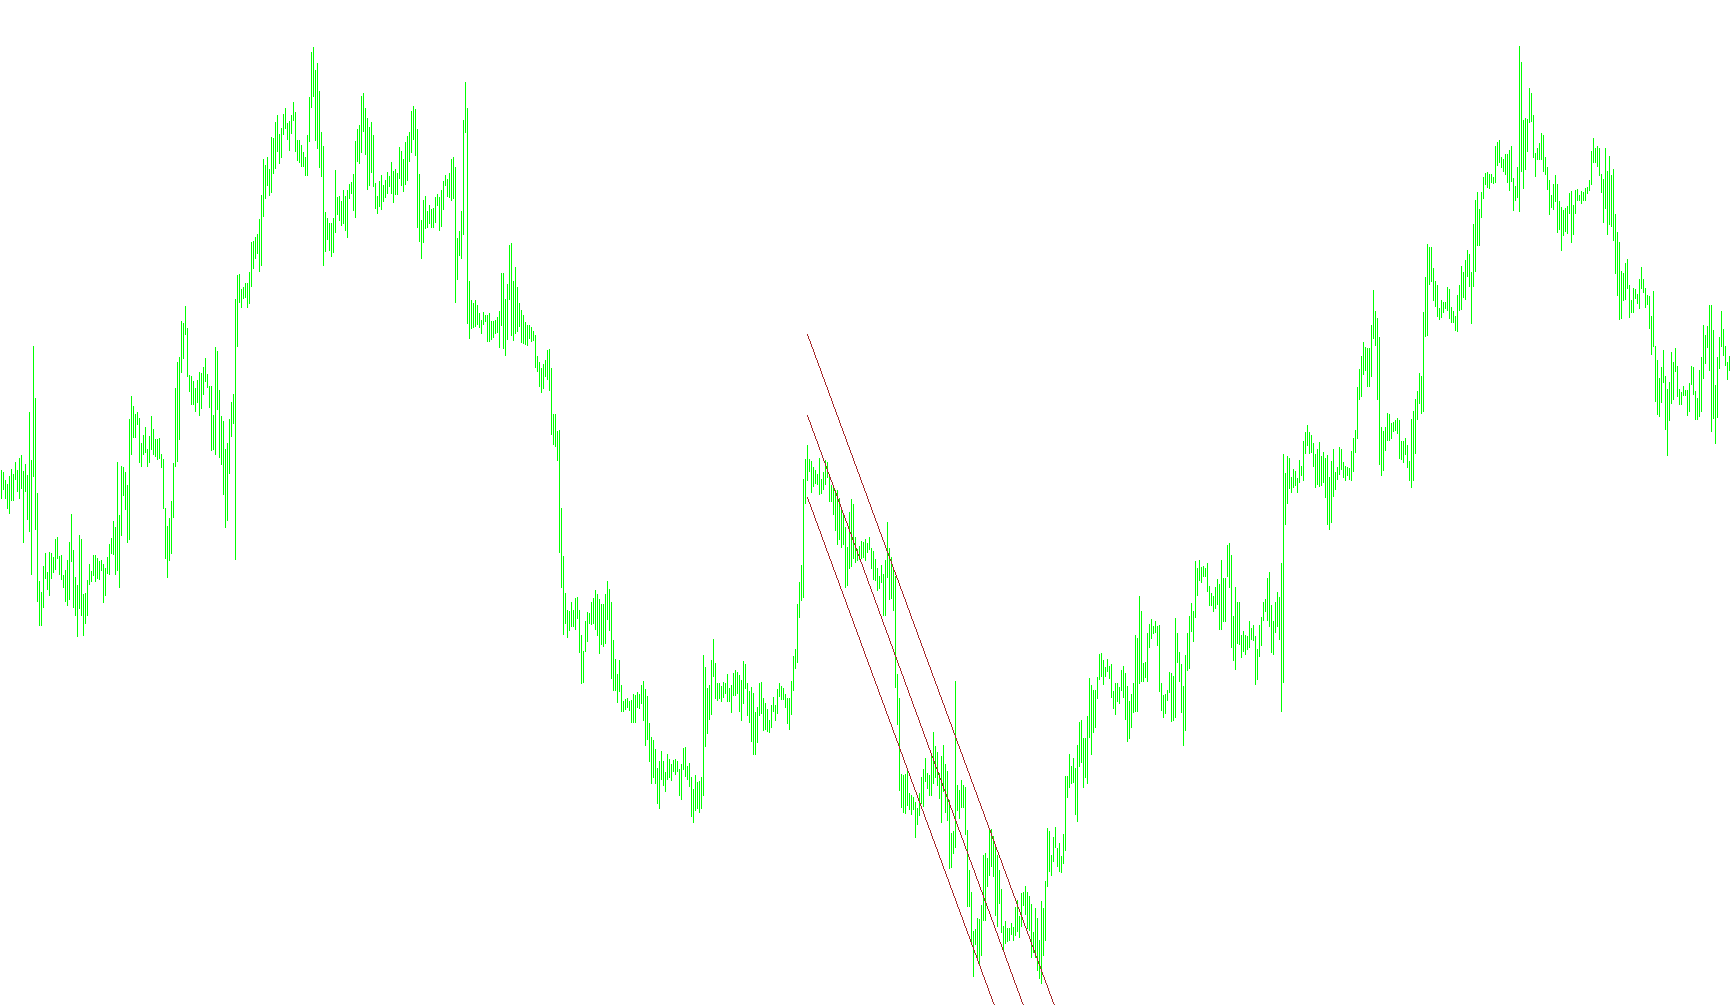
This tool is designed to automatically identify and draw a "Regression Channel" on your trading chart. A regression channel is a visual aid that helps traders understand the trend of a market by creating a corridor that encompasses price movement, making it easier to spot potential support and resistance levels.
Core Logic and Functionality
The script follows a systematic three-step process to determine how to draw this channel:
1. Identification of Key Price Points Instead of drawing a channel randomly, the tool first scans historical price data to find significant "extremes." It uses a Moving Average (a smoothed average of past prices) as a reference point. The script looks for specific moments where the price deviates significantly from this average. Specifically, it identifies the highest and lowest peaks that occur when the market shows distinct directional strength. These points serve as the "anchors" for the channel.
2. Mathematical Trend Projection (Linear Regression) Once the starting and ending anchors are identified, the script performs a mathematical calculation known as Linear Regression. It calculates the "line of best fit"—a straight path that minimizes the distance between all price points within that specific timeframe. This results in a central midline that represents the core trend of the market during that period.
3. Channel Boundary Calculation To create the upper and lower boundaries of the channel, the script measures the "Standard Deviation" (the degree of volatility or how far prices typically swing away from the midline).
- It calculates the average distance that price travels away from the center.
- It then applies a multiplier (the Standard Deviation coefficient) to create two parallel lines.
- These boundaries form a corridor: the upper line marks the "ceiling" of the price movement, and the lower line marks the "floor."
Visual Output
The result on your chart is a set of three dynamic lines:
- Middle Line: The calculated trend path (the average direction of the market).
- Upper Line: The upper boundary based on volatility.
- Lower Line: The lower boundary based on volatility.
Summary for the Trader
In simple terms, this script automates the tedious task of drawing trend lines manually. By scanning the history to find the most significant price peaks and valleys, it mathematically calculates a "corridor." This allows you to see at a glance whether the current price is staying within the expected range or if it is breaking out of the established trend boundaries.
//+------------------------------------------------------------------+
//|                                           Regression_Channel.mq4 |
//|                                        Converted to MT4 by KimIV |
//+------------------------------------------------------------------+
/*[[
	Name := Regression_Channel
	Author := Copyright © 2004, MetaQuotes Software Corp.
	Link := http://www.metaquotes.net/
]]*/
#property copyright "KimIV"
#property link      "http://www.kimiv.ru"

#property indicator_chart_window

//------- Âíåøíèå ïàðàìåòðû èíäèêàòîðà -------------------------------
extern int    NumberName   = 1;
extern int    iPeriod      = 56;
extern double MAShoot      = 50;
extern int    LineWeight   = 1;
extern double StDev = 1.618;
extern color LineColor = Brown;


//+------------------------------------------------------------------+
//| Custom indicator initialization function                         |
//+------------------------------------------------------------------+
void init() {
  ObjectCreate("Regression_middle"+NumberName, OBJ_TREND, 0, 0,0, 0,0);
	ObjectSet("Regression_middle"+NumberName, OBJPROP_COLOR, LineColor);
 	ObjectSet("Regression_middle"+NumberName, OBJPROP_STYLE, STYLE_SOLID);
 	ObjectSet("Regression_middle"+NumberName, OBJPROP_WIDTH, LineWeight);
  ObjectCreate("Regression_upper" +NumberName, OBJ_TREND, 0, 0,0, 0,0);
 	ObjectSet("Regression_upper"+NumberName, OBJPROP_STYLE, STYLE_SOLID);
 	ObjectSet("Regression_upper"+NumberName, OBJPROP_WIDTH, LineWeight);
  ObjectCreate("Regression_lower" +NumberName, OBJ_TREND, 0, 0,0, 0,0);
 	ObjectSet("Regression_lower"+NumberName, OBJPROP_STYLE, STYLE_SOLID);
 	ObjectSet("Regression_lower"+NumberName, OBJPROP_WIDTH, LineWeight);

  Comment("Auto Regression channel");
}

//+------------------------------------------------------------------+
//| Custor indicator deinitialization function                       |
//+------------------------------------------------------------------+
void deinit() {
  ObjectDelete("Regression_middle"+NumberName);
  ObjectDelete("Regression_upper" +NumberName);
  ObjectDelete("Regression_lower" +NumberName);
  Comment("");
}

//+------------------------------------------------------------------+
//| Custom indicator iteration function                              |
//+------------------------------------------------------------------+
void start() {
  bool   check_low, check_high;
  bool   check_upper_chanel;
  double save_low, save_high;
  double MA, a1, a2, a3, b1, a_, b_, y1, y2, price;
  double stddiv_low, stddiv_high, tmp_div;
  double x_n_up, x_1_up, x_n_down, x_1_down;
  double ratio_currency;
  int     shift;
  int    n, n_begin, n_end;
  int    MAType, MAPrice;
  int    save_shift_low, save_shift_high;

  save_low = -1;
  save_high = -1;
  save_shift_low = -1;
  save_shift_high = -1;

  check_low = false;
  check_high = false;

  MAType = MODE_SMA;
  MAPrice = PRICE_CLOSE;

  if (Close[1]>80) ratio_currency = 100;
  else ratio_currency = 10000;

  // Ïîèñê òî÷åê ïåðåñå÷åíèÿ ñ ÌÀ
  for (shift=Bars-1; shift>=0; shift--) {
  	MA = iMA(NULL, 0, iPeriod, 0, MAType, MAPrice, shift);
  	if (MA-MAShoot/ratio_currency>Close[shift])	{
  		if (Close[shift]<save_low || save_low==-1) {
  			check_low = true;
  			save_low = Close[shift];
  			save_shift_low = shift;
  		}
  	}

  	if (MA+MAShoot/ratio_currency<Close[shift]) {
  		if (save_high<Close[shift] || save_high==-1) {
  			check_high = true;
  			save_high = Close[shift];
  			save_shift_high = shift;
  		}
  	}

  	if (check_low) {
  		if (MA+MAShoot/ratio_currency<Close[shift])	{
  			check_low = false;
  			save_low = -1;
  		}
  	}

  	if (check_high) {
  		if (MA-MAShoot/ratio_currency>Close[shift]) {
  			check_high = false;
  			save_high = -1;
  		}
  	}
  }

  //Îïðåäåëåíèå ãðàíèö ïîñòðîåíèÿ êàíàëëà
  if (save_shift_low>save_shift_high) {
  	n_begin = save_shift_low;
  	n_end = save_shift_high;
  } else {
  	n_begin = save_shift_high;
  	n_end = save_shift_low;
  }

  if (n_end==0) n_end = 1; // Íóëåâîé áàð íå èñïîëüçîâàòü
  n = n_begin - n_end + 1; // äëèíà êàíàëà

  a1 = 0;
  a2 = 0;
  a3 = 0;
  b1 = 0;
  a_ = 0;
  b_ = 0;
  y1 = 0;
  y2 = 0;
  tmp_div = 0;

  if (Close[n_begin]<Close[n_end]) check_upper_chanel = true;
  else check_upper_chanel = false;

  for (shift=n_begin; shift>=n_end; shift--) {
  	if (check_upper_chanel) price = Low[shift];
  	else price = High[shift];

  	a1 = a1 + shift*price;
  	a2 = a2 + shift;
  	a3 = a3 + price;
  	b1 = b1 + shift*shift;
  }

  b_ = (n*a1 - a2*a3)/(n*b1 - a2*a2);
  a_ = (a3 - b_*a2)/n;
  y1 = a_ + b_*n_begin;
  y2 = a_ + b_*n_end;

 	ObjectSet("Regression_middle"+NumberName, OBJPROP_TIME1, Time[n_begin]);
 	ObjectSet("Regression_middle"+NumberName, OBJPROP_TIME2, Time[n_end]);
 	ObjectSet("Regression_middle"+NumberName, OBJPROP_PRICE1, y1);
 	ObjectSet("Regression_middle"+NumberName, OBJPROP_PRICE2, y2);

  for (shift=n_begin; shift>=n_end; shift--) {
  	if (check_upper_chanel) price = Low[shift];
	  else price = High[shift];

  	tmp_div = tmp_div + (price - (a_ + b_*shift))*(price - (a_ + b_*shift));
  }

  stddiv_low = MathSqrt(tmp_div/n);
  stddiv_high = MathSqrt(tmp_div/n);

  x_n_up = y1 + StDev*stddiv_high;
  x_1_up = y2 + StDev*stddiv_high;

  x_n_down = y1 - StDev*stddiv_low;
  x_1_down = y2 - StDev*stddiv_low;


  //upper
 	ObjectSet("Regression_upper"+NumberName, OBJPROP_TIME1, Time[n_begin]);
 	ObjectSet("Regression_upper"+NumberName, OBJPROP_TIME2, Time[n_end]);
 	ObjectSet("Regression_upper"+NumberName, OBJPROP_PRICE1, x_n_up);
 	ObjectSet("Regression_upper"+NumberName, OBJPROP_PRICE2, x_1_up);
	ObjectSet("Regression_upper"+NumberName, OBJPROP_COLOR, LineColor);
  //lower
 	ObjectSet("Regression_lower"+NumberName, OBJPROP_TIME1, Time[n_begin]);
 	ObjectSet("Regression_lower"+NumberName, OBJPROP_TIME2, Time[n_end]);
 	ObjectSet("Regression_lower"+NumberName, OBJPROP_PRICE1, x_n_down);
 	ObjectSet("Regression_lower"+NumberName, OBJPROP_PRICE2, x_1_down);
 	ObjectSet("Regression_lower"+NumberName, OBJPROP_COLOR, LineColor);


}
//-------------------------------------------------------------------+
Comments