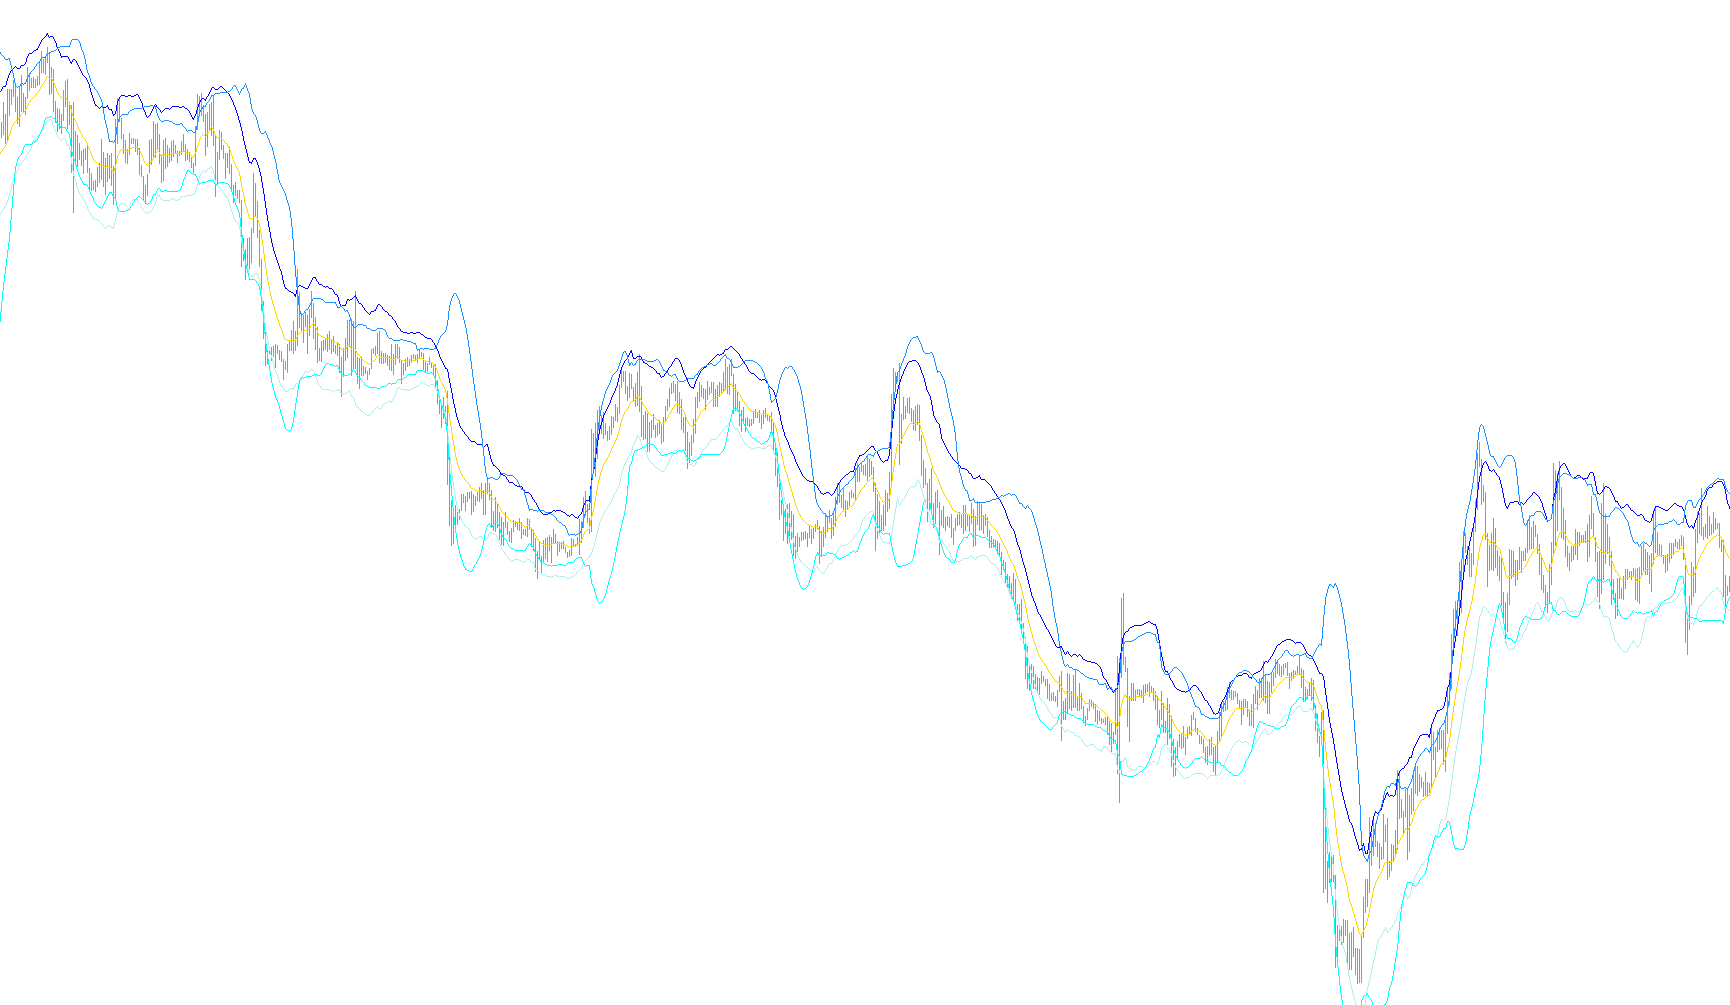
This tool is a technical analysis indicator designed to help traders visualize market trends and volatility by combining two distinct mathematical models: the Bollinger Bands and the STARC Bands. By overlaying these two systems on a price chart, it provides a comprehensive view of where the market is currently moving and how much "room" it has to fluctuate.
How the Logic Works
The script functions by calculating two separate sets of "bands" that wrap around the current price action:
1. The Bollinger Bands (Market Volatility) These are standard industry indicators used to identify when a price is moving significantly far away from its average. The logic looks at a specific timeframe of recent price history and calculates a standard deviation.
- The Upper Band shows the ceiling of normal volatility.
- The Lower Band shows the floor of normal volatility.
- When the price pushes outside these lines, it often signals that the market is overextended (overbought or oversold).
2. The STARC Bands (Trend Momentum) While Bollinger Bands focus on standard deviation, the STARC Bands are designed to identify the "core" trend using different mathematical components:
- The Midline: This uses an Exponential Moving Average (EMA), which gives more weight to recent price changes to determine the current direction.
- The Upper and Lower Boundaries: These are calculated by taking that midline and adding or subtracting a value based on the "Average True Range" (ATR). This measures how much the price typically moves in a single candle. By multiplying this range by a specific factor, the tool creates a dynamic channel that expands during high-activity periods and contracts when the market is quiet.
Summary for the Trader
When you use this script on a chart, you aren't just seeing one set of lines; you are seeing a "double-filtered" view of the market:
- Trend Identification: The STARC Bands help you see the immediate momentum and the current "path" of the price.
- Volatility Detection: The Bollinger Bands provide a secondary layer that tells you if the current move is unusually large compared to historical norms.
By observing how the price interacts with both sets of bands simultaneously, traders can better identify potential reversal points, support and resistance levels, and periods of extreme market stress.
/*-----------------------------+
|			       |
| Shared by www.Aptrafx.com    |
|			       |
+------------------------------*/

//+------------------------------------------------------------------+
//| BOLLINGER+STARC (BollStarc-TC.mq4)                                    |
//| Copyright © 2006                                                 |
//| http://www.                                                      |
//+------------------------------------------------------------------+
#property copyright "Copyright © 2006, "
#property link "http://www.   "

#property indicator_chart_window
#property indicator_buffers 5
#property indicator_color1 DimGray // Starc midband
#property indicator_color2 Yellow //Starc upper
#property indicator_color3 Yellow
#property indicator_color4 RoyalBlue //BBupper
#property indicator_color5 RoyalBlue


//---- indicator parameters
extern int BB_Period=20;
extern int BB_Deviations=2;
extern int MA_Period=13; //6
extern int ATR_Period=21; //15
extern double KATR=2;
extern int Shift=0; //1
//---- buffers
double MovingBuffer[];
double UpperBuffer[];
double LowerBuffer[];

double ExtMapBuffer1[];
double ExtMapBuffer2[];

//+------------------------------------------------------------------+
//| Custom indicator initialization function |
//+------------------------------------------------------------------+
int init()
{
  //---- indicators
  SetIndexStyle(0,DRAW_LINE,0,1);
  SetIndexBuffer(0,MovingBuffer);
  SetIndexStyle(1,DRAW_LINE,STYLE_SOLID,1);
  SetIndexBuffer(1,UpperBuffer);
  SetIndexStyle(2,DRAW_LINE,STYLE_SOLID,1);
  SetIndexBuffer(2,LowerBuffer);
  //----
  SetIndexDrawBegin(0,MA_Period+Shift);
  SetIndexDrawBegin(1,ATR_Period+Shift);
  SetIndexDrawBegin(2,ATR_Period+Shift);
  //---- BB start
  SetIndexStyle(3,DRAW_LINE,STYLE_SOLID,1);
  SetIndexBuffer(3,ExtMapBuffer1);
  SetIndexStyle(4,DRAW_LINE,STYLE_SOLID,1);
  SetIndexBuffer(4,ExtMapBuffer2);
  //----
  SetIndexDrawBegin(3,BB_Period);
  SetIndexDrawBegin(4,BB_Period);
  //---- BB ends

  return(0);
}

//+------------------------------------------------------------------+
//| Bollinger+STARC Bands                                                      |
//+------------------------------------------------------------------+
int start()
{
  int i,k,counted_bars=IndicatorCounted();

  //----
  if(Bars<=MA_Period) return(0);

  //---- initial zero
  if(counted_bars<1)
  for(i=1;i<=MA_Period;i++)
  {
    MovingBuffer[Bars-i]=EMPTY_VALUE;
    UpperBuffer[Bars-i]=EMPTY_VALUE;
    LowerBuffer[Bars-i]=EMPTY_VALUE;
    ExtMapBuffer1[Bars-i]=EMPTY_VALUE;
    ExtMapBuffer2[Bars-i]=EMPTY_VALUE;
  }

  //----
  int limit=Bars-counted_bars;
  if(counted_bars>0) limit++;
  for(i=0; i<limit; i++)
  {
    //STARC Bands
    MovingBuffer[i] = iMA(NULL,0,MA_Period,Shift,MODE_EMA,PRICE_CLOSE,i);
    UpperBuffer[i] = MovingBuffer[i] + (KATR * iATR(NULL,0,ATR_Period,i+Shift));
    LowerBuffer[i] = MovingBuffer[i] - (KATR * iATR(NULL,0,ATR_Period,i+Shift));
    //BBands
    ExtMapBuffer1[i]=iBands(NULL,0,BB_Period,BB_Deviations,0,PRICE_CLOSE,MODE_UPPER,i);
    ExtMapBuffer2[i]=iBands(NULL,0,BB_Period,BB_Deviations,0,PRICE_CLOSE,MODE_LOWER,i);

  }

  //----
  return(0);
}

//+-----------------------------------------------------------------+
Comments