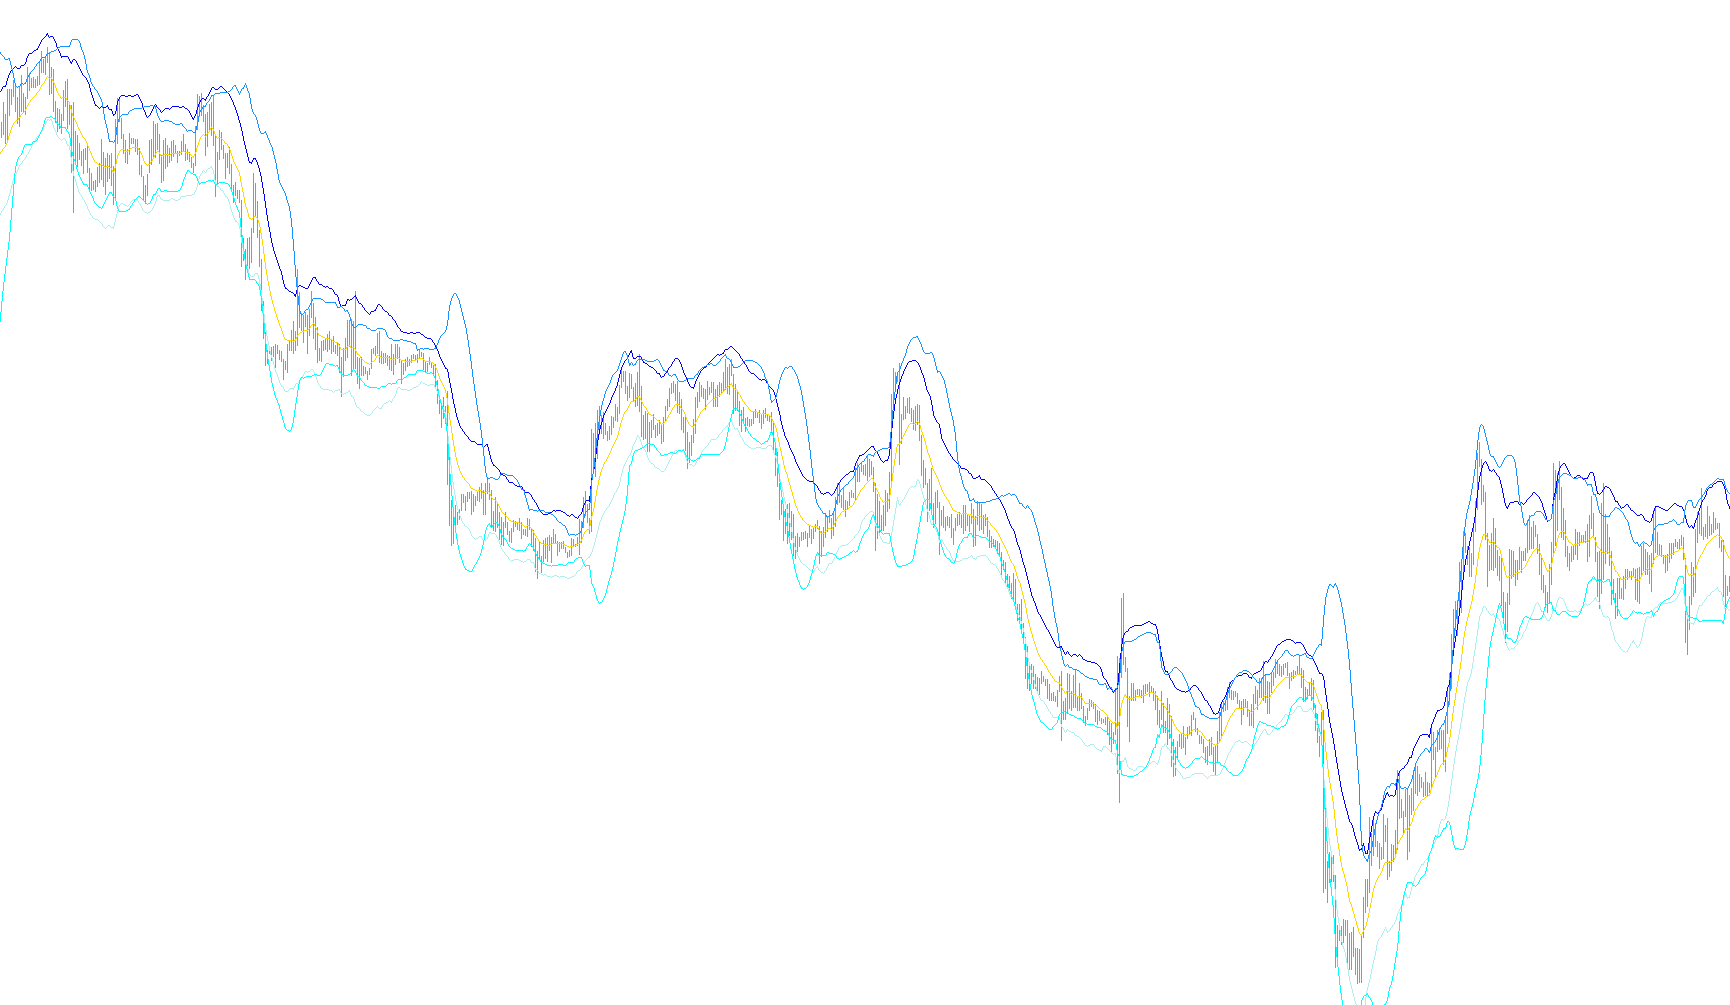
This tool is a technical analysis indicator designed to provide traders with a comprehensive visual overview of market volatility and price trends. It functions by overlaying two distinct types of dynamic trading channels—the STARC Bands and the Bollinger Bands—on a single chart. By combining these two methodologies, the script allows users to identify potential overbought or oversold conditions and assess the strength of current market momentum.
How the Logic Works
The script processes market data to generate two separate sets of boundaries around the current price:
1. The STARC Bands This component focuses on a smoothed average of the price. It calculates a "mid-line" based on an Exponential Moving Average (EMA), which helps identify the core trend. It then projects two outer boundaries (Upper and Lower) based on the Average True Range (ATR). Because the ATR measures how much an asset typically moves in a specific timeframe, these bands adjust automatically to the market's current "heartbeat"—expanding when the market is volatile and contracting when it is calm.
2. The Bollinger Bands Simultaneously, the script calculates standard Bollinger Bands. These are a staple of technical analysis that use a different logic: they calculate a moving average and then plot bands based on Standard Deviation. This represents how far the price is deviating from its recent average. While the STARC bands react more to the intensity of price movement (volatility), the Bollinger Bands highlight the statistical likelihood of price extremes.
Key Visual Elements
When viewing the chart, you will see five distinct lines:
- The Mid-Line: Represents the core trend of the STARC calculation.
- STARC Upper & Lower Boundaries: These show the range of "normal" movement based on recent volatility.
- Bollinger Upper & Lower Boundaries: These provide a secondary layer of statistical confirmation for price extremes.
Practical Application
By observing where these two sets of bands intersect or expand, traders can gain a deeper understanding of market behavior. When the price pushes toward the outer edges of both sets of bands simultaneously, it often signals that the asset is reaching an extreme point in its current cycle. Conversely, when the bands are tight and compressed, it may indicate a period of consolidation before a potential breakout. This dual-layered approach helps filter out "noise," providing a more balanced view of whether a price movement is a significant trend or just a temporary fluctuation.
//+------------------------------------------------------------------+
//| BOLLINGER+STARC (BollStarc-TC.mq4)                                    |
//| Copyright © 2006                                                 |
//| http://www.                                                      |
//+------------------------------------------------------------------+
#property copyright "Copyright © 2006, "
#property link "http://www.   "

#property indicator_chart_window
#property indicator_buffers 5
#property indicator_color1 DimGray // Starc midband
#property indicator_color2 Yellow //Starc upper
#property indicator_color3 Yellow
#property indicator_color4 RoyalBlue //BBupper
#property indicator_color5 RoyalBlue


//---- indicator parameters
extern int BB_Period=20;
extern int BB_Deviations=2;
extern int MA_Period=13; //6
extern int ATR_Period=21; //15
extern double KATR=2;
extern int Shift=0; //1
//---- buffers
double MovingBuffer[];
double UpperBuffer[];
double LowerBuffer[];

double ExtMapBuffer1[];
double ExtMapBuffer2[];

//+------------------------------------------------------------------+
//| Custom indicator initialization function |
//+------------------------------------------------------------------+
int init()
{
  //---- indicators
  SetIndexStyle(0,DRAW_LINE,0,1);
  SetIndexBuffer(0,MovingBuffer);
  SetIndexStyle(1,DRAW_LINE,STYLE_SOLID,1);
  SetIndexBuffer(1,UpperBuffer);
  SetIndexStyle(2,DRAW_LINE,STYLE_SOLID,1);
  SetIndexBuffer(2,LowerBuffer);
  //----
  SetIndexDrawBegin(0,MA_Period+Shift);
  SetIndexDrawBegin(1,ATR_Period+Shift);
  SetIndexDrawBegin(2,ATR_Period+Shift);
  //---- BB start
  SetIndexStyle(3,DRAW_LINE,STYLE_SOLID,1);
  SetIndexBuffer(3,ExtMapBuffer1);
  SetIndexStyle(4,DRAW_LINE,STYLE_SOLID,1);
  SetIndexBuffer(4,ExtMapBuffer2);
  //----
  SetIndexDrawBegin(3,BB_Period);
  SetIndexDrawBegin(4,BB_Period);
  //---- BB ends

  return(0);
}

//+------------------------------------------------------------------+
//| Bollinger+STARC Bands                                                      |
//+------------------------------------------------------------------+
int start()
{
  int i,k,counted_bars=IndicatorCounted();

  //----
  if(Bars<=MA_Period) return(0);

  //---- initial zero
  if(counted_bars<1)
  for(i=1;i<=MA_Period;i++)
  {
    MovingBuffer[Bars-i]=EMPTY_VALUE;
    UpperBuffer[Bars-i]=EMPTY_VALUE;
    LowerBuffer[Bars-i]=EMPTY_VALUE;
    ExtMapBuffer1[Bars-i]=EMPTY_VALUE;
    ExtMapBuffer2[Bars-i]=EMPTY_VALUE;
  }

  //----
  int limit=Bars-counted_bars;
  if(counted_bars>0) limit++;
  for(i=0; i<limit; i++)
  {
    //STARC Bands
    MovingBuffer[i] = iMA(NULL,0,MA_Period,Shift,MODE_EMA,PRICE_CLOSE,i);
    UpperBuffer[i] = MovingBuffer[i] + (KATR * iATR(NULL,0,ATR_Period,i+Shift));
    LowerBuffer[i] = MovingBuffer[i] - (KATR * iATR(NULL,0,ATR_Period,i+Shift));
    //BBands
    ExtMapBuffer1[i]=iBands(NULL,0,BB_Period,BB_Deviations,0,PRICE_CLOSE,MODE_UPPER,i);
    ExtMapBuffer2[i]=iBands(NULL,0,BB_Period,BB_Deviations,0,PRICE_CLOSE,MODE_LOWER,i);

  }

  //----
  return(0);
}

//+-----------------------------------------------------------------+
Comments