Mirror_Bands
Download script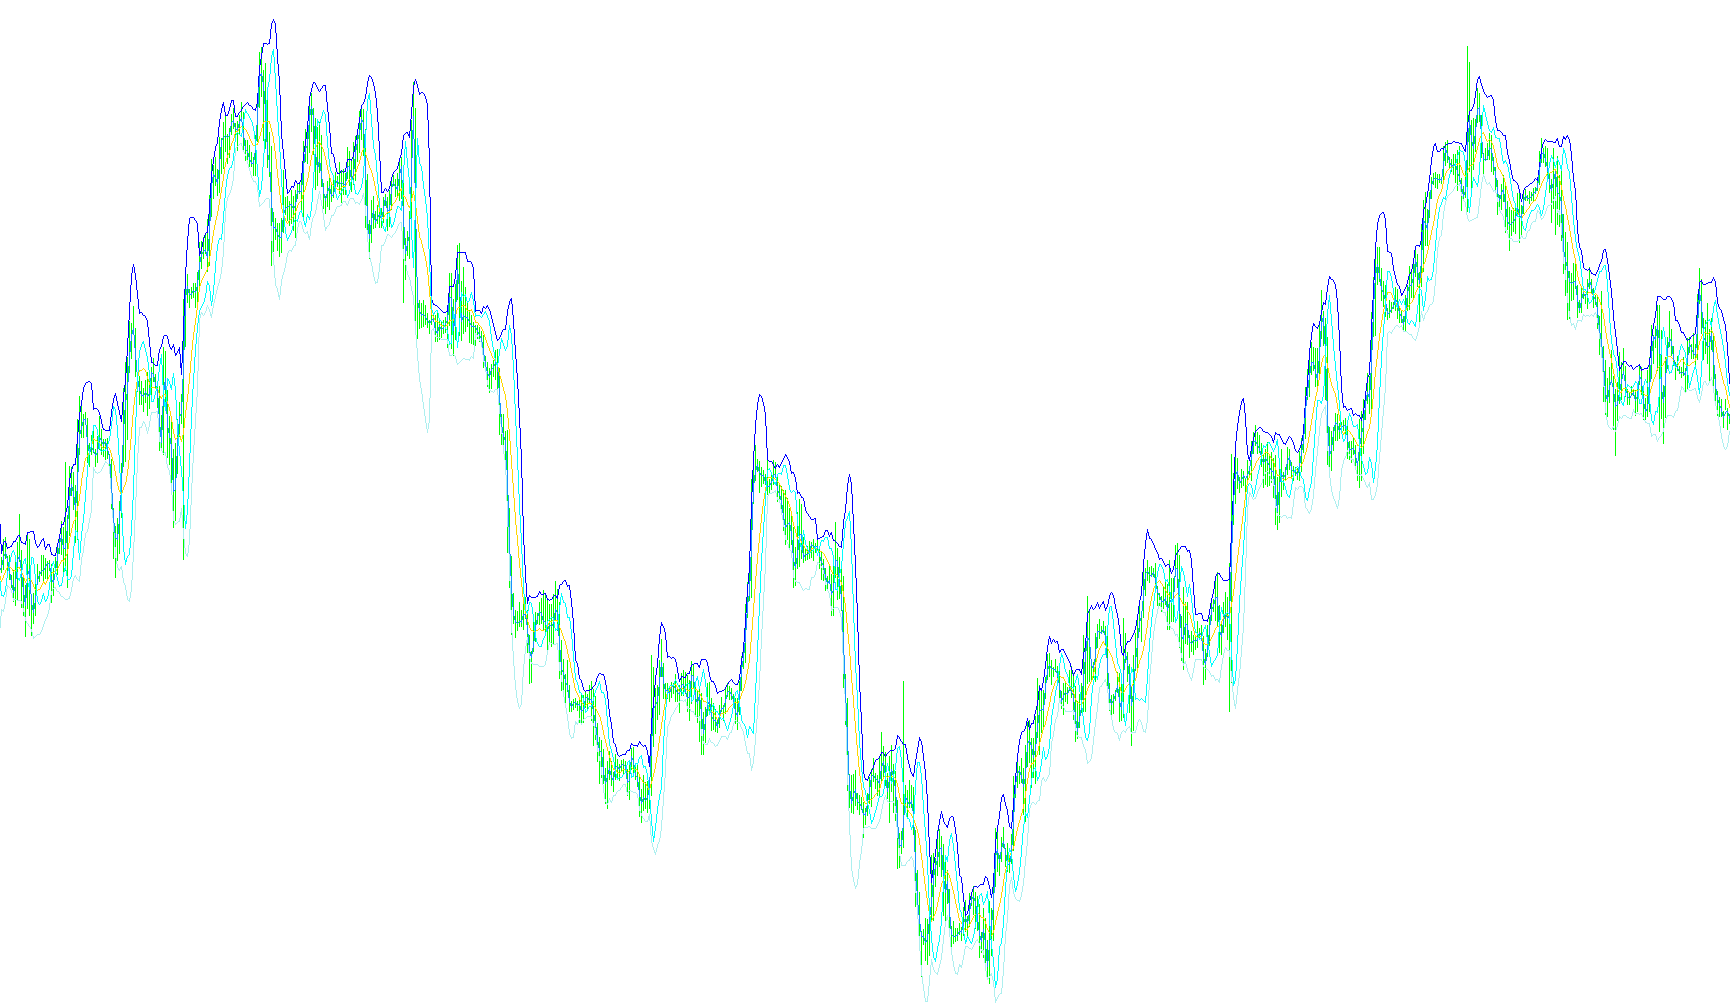
This script is a specialized visual tool designed for trading charts to help identify price trends and potential reversals by analyzing price volatility. It works by overlaying three distinct sets of data onto your chart: a central trend line, standard volatility boundaries, and a "mirrored" secondary calculation.
Core Functionality
1. The Primary Trend and Volatility Bands At its foundation, the script calculates a Moving Average, which serves as the "heartbeat" of the current price action. Around this average, it builds a set of outer boundaries (similar to Bollinger Bands). These bands expand when the market is volatile and contract when the market is stable. They essentially define the "normal" range of price movement based on your chosen period and deviation settings.
2. The Mirror Logic What makes this specific script unique is the inclusion of "Mirror" lines. The logic creates a secondary set of calculations based on a shorter time perspective compared to the main bands.
- It calculates a fast-moving average (a shorter period).
- It then mathematically projects a mirrored value by calculating the difference between the primary trend and this faster movement.
- This results in a visual representation that helps traders see the relationship between short-term momentum and longer-term trends simultaneously.
How it Works for the Trader
Instead of looking at just one indicator, this script provides a multi-layered view:
- The Center Line: Shows you the overall direction of the market.
- The Main Bands: Show you the "ceiling" and "floor" of current price behavior.
- The Mirror Lines: Provide an extra layer of perspective, highlighting how much the short-term price is deviating from the long-term average.
By observing where these lines converge, diverge, or where the price interacts with the boundaries versus the mirrored projections, traders can better visualize whether the market is overextended, consolidating, or beginning a new trend.
//+------------------------------------------------------------------+
//|                                                 Mirror_Bands.mq4 |
//|                           Copyright © 2011, Andy Tjatur Pramono. |
//|                                            andy.tjatur@gmail.com |
//+------------------------------------------------------------------+
#property  copyright "Copyright © 2011, Andy Tjatur Pramono."
#property  link      "andy.tjatur@gmail.com"

#property indicator_chart_window
#property indicator_buffers 5
#property indicator_color1 White
#property indicator_color2 Aqua
#property indicator_color3 Aqua
#property indicator_color4 Red
#property indicator_color5 Blue

#property  indicator_width1  2
#property  indicator_width2  1
#property  indicator_width3  1
#property  indicator_width4  2
#property  indicator_width5  2

//---- indicator parameters
extern int    BandsPeriod=9;
extern int    BandsPeriod2=2;
extern int    BandsShift=0;
extern double BandsDeviations=2.0;
//---- buffers
double MovingBuffer[];
double UpperBuffer[];
double LowerBuffer[];
double UpperMirror[];
double LowerMirror[];
//+------------------------------------------------------------------+
//| Custom indicator initialization function                         |
//+------------------------------------------------------------------+
int init()
  {
//---- indicators
   SetIndexStyle(0,DRAW_LINE);
   SetIndexBuffer(0,MovingBuffer);
   SetIndexStyle(1,DRAW_LINE);
   SetIndexBuffer(1,UpperBuffer);
   SetIndexStyle(2,DRAW_LINE);
   SetIndexBuffer(2,LowerBuffer);
   SetIndexStyle(3,DRAW_LINE);
   SetIndexBuffer(3,UpperMirror);
   SetIndexStyle(4,DRAW_LINE);
   SetIndexBuffer(4,LowerMirror);
//----
   SetIndexDrawBegin(0,BandsPeriod+BandsShift);
   SetIndexDrawBegin(1,BandsPeriod+BandsShift);
   SetIndexDrawBegin(2,BandsPeriod+BandsShift);
   SetIndexDrawBegin(3,BandsPeriod2+BandsShift);
   SetIndexDrawBegin(4,BandsPeriod2+BandsShift);
//----
   return(0);
  }
//+------------------------------------------------------------------+
//| Bollinger Bands                                                  |
//+------------------------------------------------------------------+
int start()
  {
   int    i,k,counted_bars=IndicatorCounted();
   double deviation;
   double sum,oldval,newres;
//----
   if(Bars<=BandsPeriod) return(0);
//---- initial zero
   if(counted_bars<1)
      for(i=1;i<=BandsPeriod;i++)
        {
         MovingBuffer[Bars-i]=EMPTY_VALUE;
         UpperBuffer[Bars-i]=EMPTY_VALUE;
         LowerBuffer[Bars-i]=EMPTY_VALUE;
        }
//----
   int limit=Bars-counted_bars;
   if(counted_bars>0) limit++;
   for(i=0; i<limit; i++)
      MovingBuffer[i]=iMA(NULL,0,BandsPeriod,BandsShift,MODE_SMA,PRICE_CLOSE,i);
//----
   i=Bars-BandsPeriod+1;
   if(counted_bars>BandsPeriod-1) i=Bars-counted_bars-1;
   while(i>=0)
     {
      sum=0.0;
      k=i+BandsPeriod-1;
      oldval=MovingBuffer[i];
      while(k>=i)
        {
         newres=Close[k]-oldval;
         sum+=newres*newres;
         k--;
        }
      deviation=BandsDeviations*MathSqrt(sum/BandsPeriod);
      UpperBuffer[i]=oldval+deviation;
      LowerBuffer[i]=oldval-deviation;
      UpperMirror[i]=iMA(NULL,0,BandsPeriod2,BandsShift,MODE_SMA,PRICE_CLOSE,i);
      LowerMirror[i]=iMA(NULL,0,BandsPeriod,BandsShift,MODE_SMA,PRICE_CLOSE,i)+(iMA(NULL,0,BandsPeriod,BandsShift,MODE_SMA,PRICE_CLOSE,i)-iMA(NULL,0,BandsPeriod2,BandsShift,MODE_SMA,PRICE_CLOSE,i));
      i--;
     }
//----
   return(0);
  }
//+------------------------------------------------------------------+
Comments