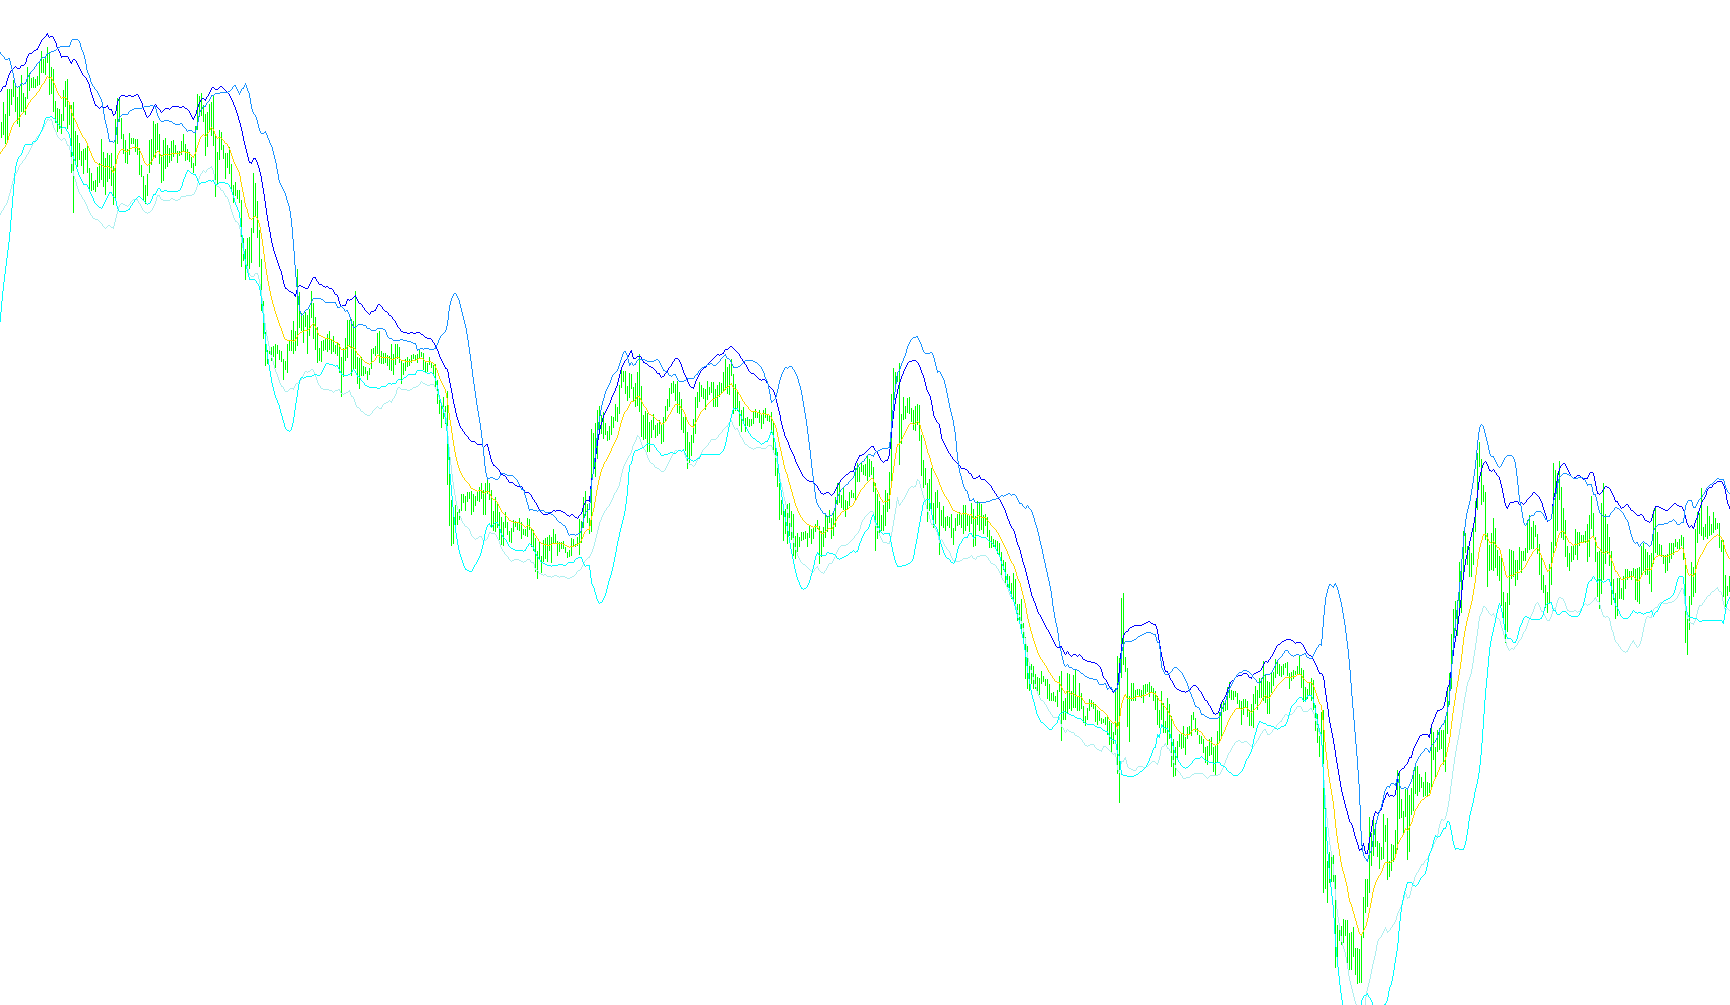
This technical tool combines two distinct types of market analysis techniques into a single visual indicator. By merging these methods, it provides traders with a comprehensive view of both the current price trend and the overall market volatility.
How the Logic Works
The script operates by calculating three separate layers of data simultaneously to provide a "layered" view of the marketplace:
1. The STARC Bands (Trend and Volatility) The core of this analysis uses a smoothed moving average as its center line. This represents the "average" price over a specific period, helping to filter out minor price fluctuations. Surrounding this center line are upper and lower boundaries calculated using an Average True Range (ATR).
- The purpose: These bands react to how much the price is moving on average. When the market is quiet, the bands contract; when the market becomes volatile, the bands expand. This helps traders identify "overextended" prices relative to recent volatility.
2. The Bollinger Bands (Price Extremes) In addition to the STARC bands, the script overlays standard Bollinger Bands. Unlike the first set of bands, these are calculated based on a different mathematical standard deviation.
- The purpose: These serve as a secondary "ceiling" and "floor." They highlight areas where the price has moved significantly far away from its recent mean, signaling potential exhaustion points or high-probability reversal zones.
3. Integrated Visual Analysis By plotting both systems on your chart at once, the script allows you to see the relationship between different types of volatility.
- The Moving Average acts as the baseline for the trend.
- The STARC Bands show you the immediate "breathing room" of the price based on recent movement.
- The Bollinger Bands provide a wider perspective on extreme price boundaries.
Key Benefits for the User
Instead of looking at two separate indicators, this script consolidates the data into one workspace. It allows you to observe where different types of volatility overlap. For example, if the price is pushing outside of both sets of bands simultaneously, it indicates an exceptionally strong move that may be reaching a breaking point, providing a clearer picture of market sentiment than either tool could offer alone.
//+------------------------------------------------------------------+
//| BOLLINGER+STARC (BollStarc-TC.mq4)                               |
//| Copyright © 2006                                                 |
//|                                                                  |
//+------------------------------------------------------------------+
#property copyright "Copyright © 2006, "
#property link "http://www.   "
//----
#property indicator_chart_window
#property indicator_buffers 5
#property indicator_color1 DimGray // Starc midband
#property indicator_color2 Yellow //Starc upper
#property indicator_color3 Yellow
#property indicator_color4 RoyalBlue //BBupper
#property indicator_color5 RoyalBlue
//---- indicator parameters
extern int BB_Period=20;
extern int BB_Deviations=2;
extern int MA_Period=13; //6
extern int ATR_Period=21; //15
extern double KATR=2;
extern int Shift=0; //1
//---- buffers
double MovingBuffer[];
double UpperBuffer[];
double LowerBuffer[];
double ExtMapBuffer1[];
double ExtMapBuffer2[];
//+------------------------------------------------------------------+
//| Custom indicator initialization function                         |
//+------------------------------------------------------------------+
int init()
  {
//---- indicators
   SetIndexStyle(0,DRAW_LINE,0,1);
   SetIndexBuffer(0,MovingBuffer);
   SetIndexStyle(1,DRAW_LINE,STYLE_SOLID,1);
   SetIndexBuffer(1,UpperBuffer);
   SetIndexStyle(2,DRAW_LINE,STYLE_SOLID,1);
   SetIndexBuffer(2,LowerBuffer);
//----
   SetIndexDrawBegin(0,MA_Period+Shift);
   SetIndexDrawBegin(1,ATR_Period+Shift);
   SetIndexDrawBegin(2,ATR_Period+Shift);
//---- BB start
   SetIndexStyle(3,DRAW_LINE,STYLE_SOLID,1);
   SetIndexBuffer(3,ExtMapBuffer1);
   SetIndexStyle(4,DRAW_LINE,STYLE_SOLID,1);
   SetIndexBuffer(4,ExtMapBuffer2);
//----
   SetIndexDrawBegin(3,BB_Period);
   SetIndexDrawBegin(4,BB_Period);
//---- BB ends
   return(0);
  }
//+------------------------------------------------------------------+
//| Bollinger+STARC Bands                                            |
//+------------------------------------------------------------------+
int start()
  {
   int i,k,counted_bars=IndicatorCounted();
//----
   if(Bars<=MA_Period) return(0);
//---- initial zero
   if(counted_bars<1)
      for(i=1;i<=MA_Period;i++)
        {
         MovingBuffer[Bars-i]=EMPTY_VALUE;
         UpperBuffer[Bars-i]=EMPTY_VALUE;
         LowerBuffer[Bars-i]=EMPTY_VALUE;
         ExtMapBuffer1[Bars-i]=EMPTY_VALUE;
         ExtMapBuffer2[Bars-i]=EMPTY_VALUE;
        }
//----
   int limit=Bars-counted_bars;
   if(counted_bars>0) limit++;
   for(i=0; i<limit; i++)
     {
      //STARC Bands
      MovingBuffer[i]=iMA(NULL,0,MA_Period,Shift,MODE_EMA,PRICE_CLOSE,i);
      UpperBuffer[i]=MovingBuffer[i] + (KATR * iATR(NULL,0,ATR_Period,i+Shift));
      LowerBuffer[i]=MovingBuffer[i] - (KATR * iATR(NULL,0,ATR_Period,i+Shift));
      //BBands
      ExtMapBuffer1[i]=iBands(NULL,0,BB_Period,BB_Deviations,0,PRICE_CLOSE,MODE_UPPER,i);
      ExtMapBuffer2[i]=iBands(NULL,0,BB_Period,BB_Deviations,0,PRICE_CLOSE,MODE_LOWER,i);
     }
//----
   return(0);
  }
//+-----------------------------------------------------------------+
Comments