DEMA_v1
Download script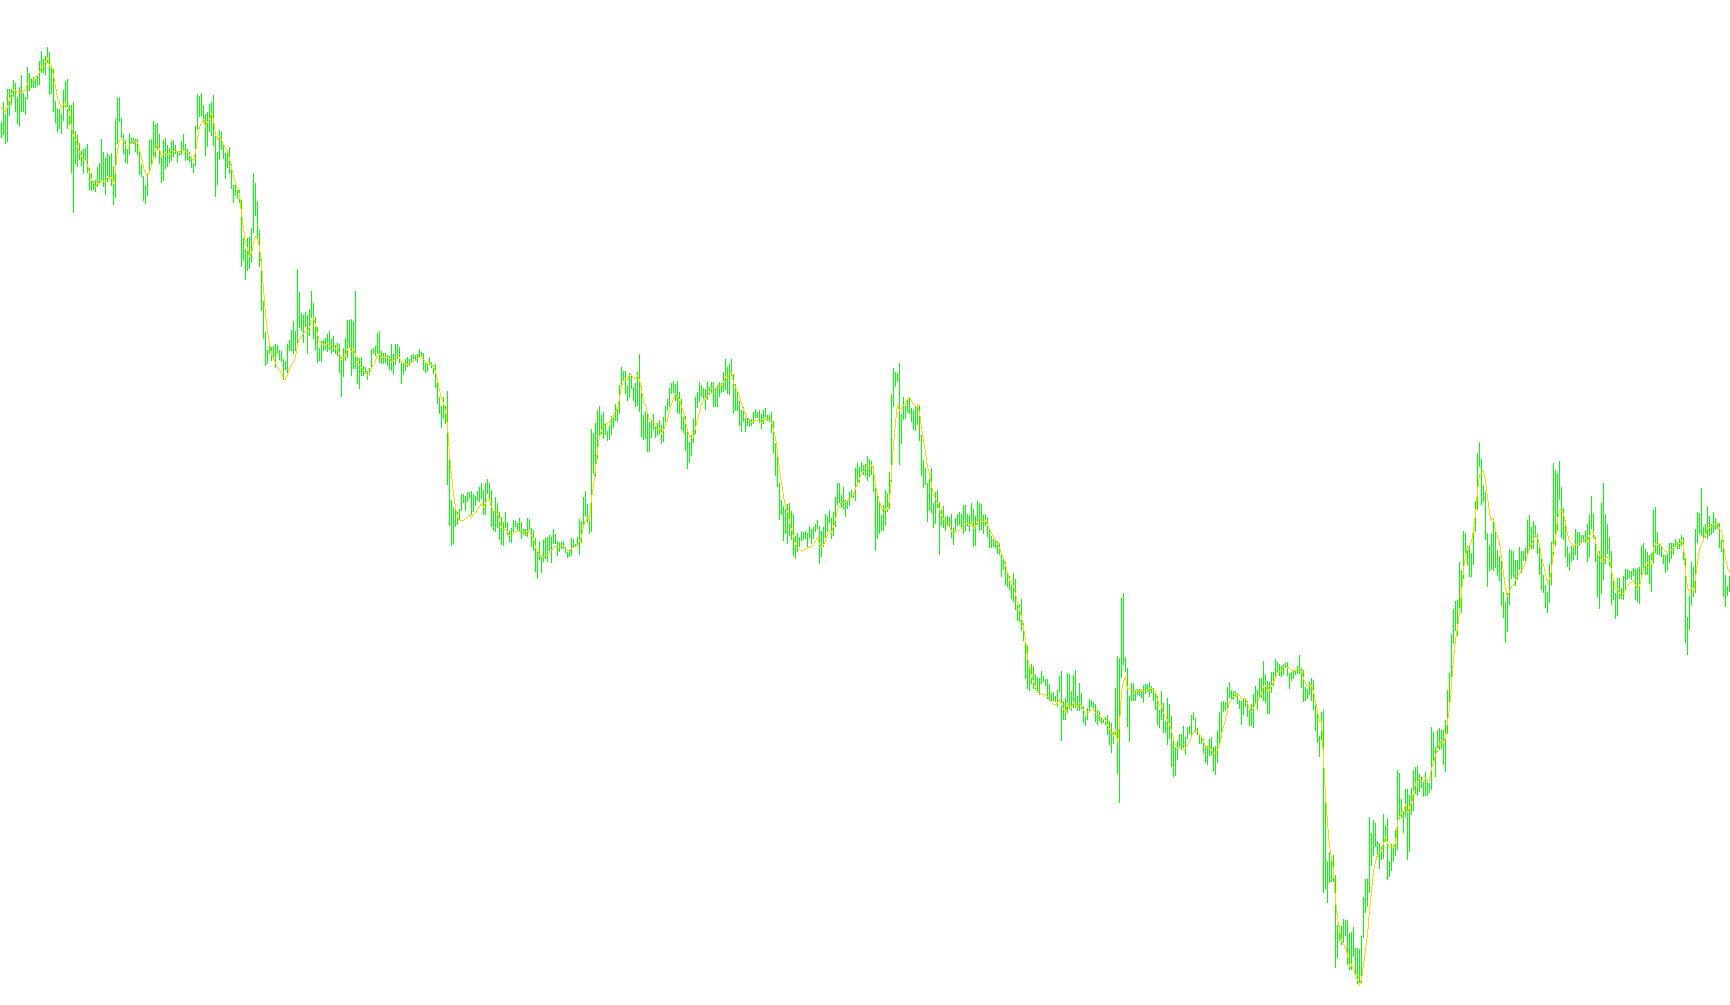
This script is designed to provide a visual tool for traders that helps identify price trends more smoothly and responsively than standard moving averages. It utilizes a specific mathematical formula known as the Double Exponential Moving Average (DEMA).
The Core Objective
The primary goal of this script is to reduce "lag." In traditional technical analysis, indicators often trail behind the actual price action, which can lead to delayed signals. By using the DEMA logic, the script attempts to stay closer to the current price while still filtering out market noise, providing a cleaner view of the market's direction.
How the Logic Works
To understand how this works without looking at the math, think of it as a two-layer smoothing process:
- The Primary Layer (EMA): First, the script calculates a standard Exponential Moving Average. Unlike a simple average that treats all past data equally, this "exponential" version gives more importance to recent price action.
- The Secondary Layer (EMA of EMA): The script then takes that first moving average and applies a second moving average to it. This essentially creates a "shadow" trend line.
- The Final Calculation: To get the final DEMA value, the script performs a specific balancing act: it doubles the first moving average and then subtracts the secondary "shadow" trend.
Practical Application on Your Chart
- Visual Representation: The script plots a red line on your trading chart.
- Responsiveness: Because of the "doubling" and "subtracting" logic described above, the resulting line reacts much faster to sudden price changes than a standard moving average would.
- Customization: The behavior of the line is governed by a "Period" setting. A shorter period will make the line react very quickly to every tick of price movement, while a longer period will smooth out the line significantly to show broader, long-term trends.
In summary, this script provides a more sophisticated, "fast-acting" trend line that helps traders see where the price is heading with less of the delay typically found in basic technical indicators.
//+------------------------------------------------------------------+
//|                                                         DEMA.mq4 |
//| DEMA = 2 * EMA - EMA of EMA													|
//+------------------------------------------------------------------+
#property link "http://www.forexfactory.com/showthread.php?t=29419"
#property indicator_chart_window
#property indicator_buffers 1
#property indicator_color1  Red
#property indicator_width1  1

//---- input parameters
extern int PERIOD	= 12;

//---- indicator buffer
double Buffer[];

//+------------------------------------------------------------------+
//| Custom indicator initialization function                         |
//+------------------------------------------------------------------+
int init()
{
	IndicatorShortName("DEMA("+PERIOD+")");
	SetIndexBuffer(0,Buffer);
	SetIndexStyle(0,DRAW_LINE);
}

//+------------------------------------------------------------------+
int start()
{
	int limit = Bars-1-IndicatorCounted();

	static double lastEMA, lastEMA_of_EMA;
	double weight = 2.0 / (1.0+PERIOD);

	if(IndicatorCounted()==0)
	{
		Buffer[limit]	= Close[limit];
		lastEMA			= Close[limit];
		lastEMA_of_EMA	= Close[limit];
		limit--;
	}

//----
//	Calculate old bars (not the latest), if necessary
	for(int i = limit; i > 0; i--)
	{
		lastEMA			= weight*Close[i]	+ (1.0-weight)*lastEMA;
		lastEMA_of_EMA	= weight*lastEMA	+ (1.0-weight)*lastEMA_of_EMA;

		Buffer[i] = 2.0*lastEMA - lastEMA_of_EMA;
	}

//----
//	(Re)calculate current bar
	double EMA			= weight*Close[0]	+ (1.0-weight)*lastEMA,
			 EMA_of_EMA	= weight*EMA		+ (1.0-weight)*lastEMA_of_EMA;

	Buffer[0] = 2.0*EMA - EMA_of_EMA;

//----
	return(0);
}
Comments