Ehlers Two Pole Super Smoother Filter
Download script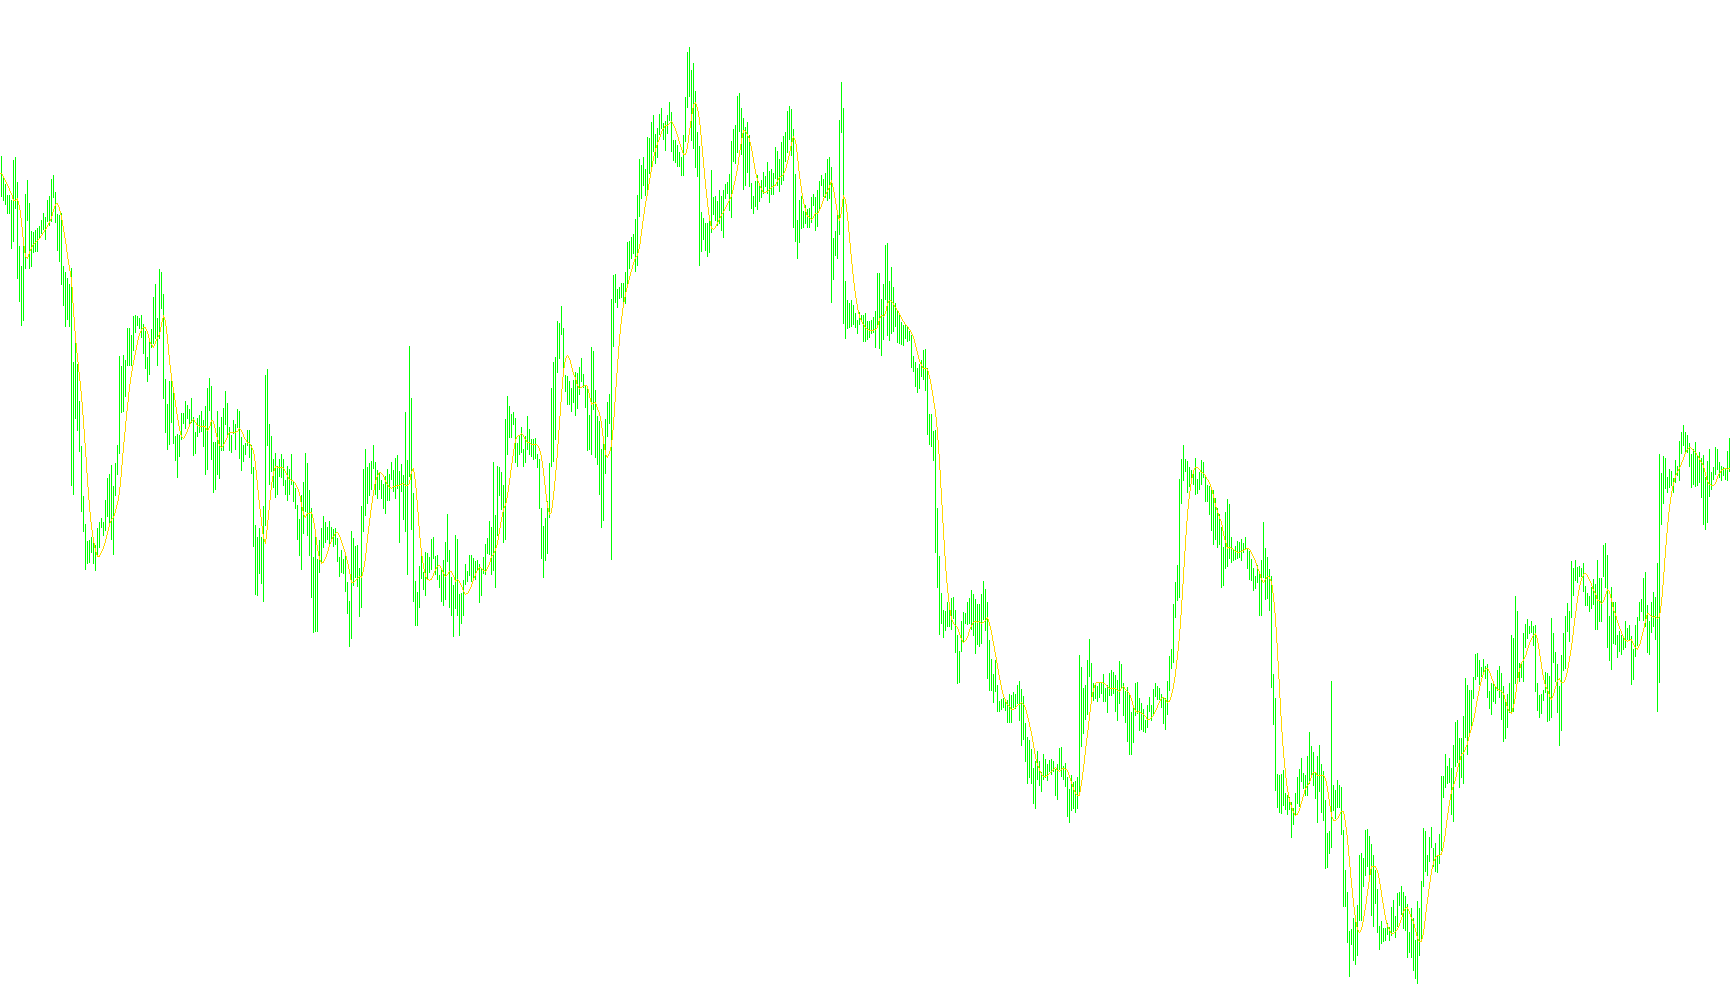
The Two-Pole Super Smoother Filter is a sophisticated technical analysis tool designed to clean up market "noise" and reveal the underlying trend of a financial asset's price action. Unlike standard moving averages that can sometimes be sluggish or lag behind significant price changes, this specific algorithm employs advanced mathematical principles to provide a more fluid and responsive visual representation of price data.
Core Logic and Functionality
The primary objective of this script is to take raw price information—specifically the opening prices of candles—and pass them through a multi-stage smoothing process. Here is how the logic operates:
- Noise Reduction: Markets are often characterized by erratic, high-frequency fluctuations. This filter acts as a sieve, filtering out these minor "jitters" so that a trader can see the actual direction of the market more clearly.
- The Two-Pole Mechanism: The "Two-Pole" aspect refers to the mathematical complexity used to achieve smoothness. It allows the indicator to react more intelligently to price changes compared to simpler filters. It balances two competing goals: removing as much noise as possible while maintaining a tight correlation with the current price.
- Customizable Sensitivity: The tool includes a "Cutoff Period" setting. This allows the user to determine the balance between responsiveness and smoothness. A shorter period will make the filter follow the price more closely (higher sensitivity), while a longer period will result in a much smoother, lazier line that ignores smaller price movements entirely.
- Dynamic Coefficient Calculation: When the script starts, it performs a series of internal calculations based on the chosen Cutoff Period. It determines specific mathematical constants (coefficients) that dictate how much weight to give to the current price versus previous smoothed values. This ensures that the curve remains consistent and mathematically sound throughout the entire chart.
Visual Output
The result of this logic is a single, continuous red line drawn on the trading chart. Instead of seeing the jagged peaks and valleys of raw price movement, the user sees a refined trajectory. By following this smoothed line, traders can more easily identify structural shifts in momentum, support levels, and the overall "flow" of the market.
//+------------------------------------------------------------------+
//|                                   TwoPoleSuperSmootherFilter.mq4 |
//|                                                                  |
//| Two-Pole Super Smoother Filter                                   |
//|                                                                  |
//| Algorithm taken from book                                        |
//|     "Cybernetics Analysis for Stock and Futures"                 |
//| by John F. Ehlers                                                |
//|                                                                  |
//|                                              contact@mqlsoft.com |
//|                                          http://www.mqlsoft.com/ |
//+------------------------------------------------------------------+
#property copyright "Coded by Witold Wozniak"
#property link      "www.mqlsoft.com"

#property indicator_chart_window
#property indicator_buffers 1
#property indicator_color1 Red

extern int CutoffPeriod = 15;

double Filter[];

int buffers = 0;
int drawBegin = 0;

double tempReal, rad2Deg, deg2Rad;
double coef1, coef2, coef3;

int init() {
    drawBegin = 4;
    initBuffer(Filter, "Two-Pole Super Smoother Filter", DRAW_LINE);
    IndicatorBuffers(buffers);
    IndicatorShortName("Two-Pole Super Smoother Filter [" + CutoffPeriod + "]");
    tempReal = MathArctan(1.0);
    rad2Deg = 45.0 / tempReal;
    deg2Rad = 1.0 / rad2Deg;
    double a1 = MathExp(-1.414 * 3.14159 / CutoffPeriod);
    double b1 = 2 * a1 * MathCos(deg2Rad * 1.414 * 180 / CutoffPeriod);
    coef2 = b1;
    coef3 = -a1 * a1;
    coef1 = 1.0 - coef2 - coef3;
    return (0);
}

int start() {
    if (Bars <= drawBegin) return (0);
    int countedBars = IndicatorCounted();
    if (countedBars < 0) return (-1);
    if (countedBars > 0) countedBars--;
    int s, limit = Bars - countedBars - 1;
    for (s = limit; s >= 0; s--) {
        Filter[s] = coef1 * P(s) +
                    coef2 * Filter[s + 1] +
                    coef3 * Filter[s + 2];
        if (s > Bars - 4) {
            Filter[s] = P(s);
        }
    }
    return (0);
}

double P(int index) {
    return (Open[index]);
    //return ((High[index] + Low[index]) / 2.0);
}

void initBuffer(double array[], string label = "", int type = DRAW_NONE, int arrow = 0, int style = EMPTY, int width = EMPTY, color clr = CLR_NONE) {
    SetIndexBuffer(buffers, array);
    SetIndexLabel(buffers, label);
    SetIndexEmptyValue(buffers, EMPTY_VALUE);
    SetIndexDrawBegin(buffers, drawBegin);
    SetIndexShift(buffers, 0);
    SetIndexStyle(buffers, type, style, width);
    SetIndexArrow(buffers, arrow);
    buffers++;
}
Comments