Forex Trend fxfariz_002
Download script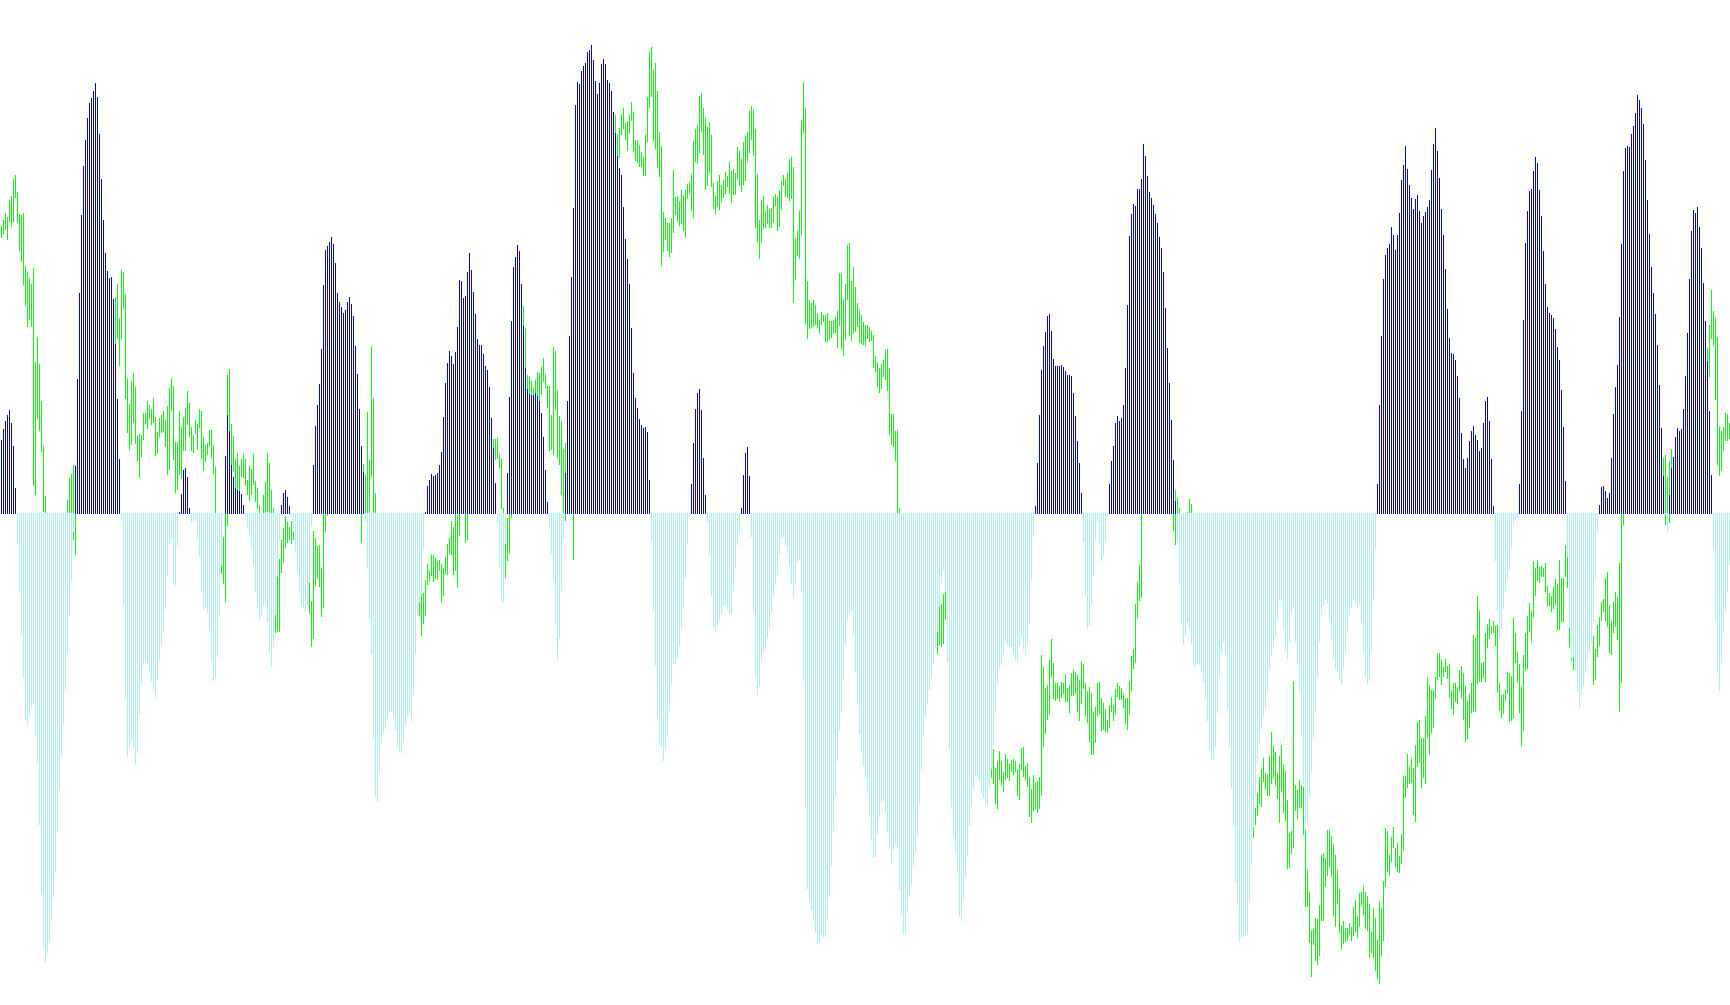
This trading tool is designed to analyze price action and identify high-probability trend shifts for scalping strategies, specifically optimized for the 5-minute timeframe. Instead of simply following raw price movement, it focuses on identifying where the price sits relative to recent historical extremes to determine momentum.
How the Logic Works
1. Defining the Market Range The tool constantly monitors a specific window of time (the "period"). Within this window, it identifies the highest price reached and the lowest price reached. By establishing these boundaries, the tool creates a visual framework of the current market "territory."
2. Position Awareness The core logic calculates exactly where the current market price is located between those highs and lows. It determines if the price is leaning toward the top of the range, the bottom, or sitting right in the middle. This calculation allows the tool to sense "pressure"—whether buyers are pushing the price up or sellers are pulling it down.
3. Smoothing and Sentiment Analysis To prevent the indicator from reacting to minor market "noise," the logic applies a smoothing calculation. It blends the current position with previous data points to create a more fluid sentiment reading. This ensures that the resulting signals represent a sustained trend rather than a momentary spike.
4. Momentum Conversion The tool then converts this sentiment into a numerical value. This represents the strength of the trend:
- A positive value suggests bullish (upward) momentum.
- A negative value suggests bearish (downward) momentum.
5. Visual Signaling Finally, the script translates these complex calculations into two distinct visual components on your chart:
- Trend Tracking: It identifies the direction of the movement. If the sentiment remains positive, it tracks the upward flow; if it turns negative, it captures the downward slide.
- Visual Separation: The tool separates these two forces into different colors (Aqua and Red). This provides a clear, immediate visual cue: one color dominates when the trend is bullish, and the other takes over immediately when the momentum shifts to bearish.
Summary for the Trader
In simple terms, this script looks at the recent "highs and lows," figures out where the price is currently hanging within that range, and smooths out that data to tell you which way the tide is moving. It filters out the distractions of small price wiggles to give you a clean, color-coded representation of whether the current momentum is leaning up or down.
//+------------------------------------------------------------------+
//|                                           fxfariz_scalpingM5.mq4 |
//|                                     fxfariz a.k.a warrior trader |
//|                                                fxfariz@gmail,com |
//+------------------------------------------------------------------+
#property copyright "fxfariz a.k.a warrior trader"
#property link      "fxfariz@gmail,com"

#property  indicator_separate_window
#property  indicator_buffers 3
#property  indicator_color2  Aqua
#property  indicator_color3  Red
#property indicator_style2 STYLE_SOLID
#property indicator_style3 STYLE_SOLID
#property indicator_width2 2
#property indicator_width3 2
extern int period=23;

double         ExtBuffer0[];
double         ExtBuffer1[];
double         ExtBuffer2[];


int init()
  {

   SetIndexStyle(0,DRAW_NONE);
   SetIndexStyle(1,DRAW_HISTOGRAM);
   SetIndexStyle(2,DRAW_HISTOGRAM);
   IndicatorDigits(Digits+1);

   SetIndexBuffer(0,ExtBuffer0);
   SetIndexBuffer(1,ExtBuffer1);
   SetIndexBuffer(2,ExtBuffer2);

   IndicatorShortName("Technique Scalping_TF5M by fxfariz");
   SetIndexLabel(1,NULL);
   SetIndexLabel(2,NULL);

   return(0);
  }


int start()
  {
   //int     period=10;
   int    limit;
   int    counted_bars=IndicatorCounted();
   double prev,current,old;
   double Value=0,Value1=0,Value2=0,Fish=0,Fish1=0,Fish2=0;
   double price;
   double MinL=0;
   double MaxH=0;


   if(counted_bars>0) counted_bars--;
   limit=Bars-counted_bars;


   for(int i=0; i<Bars; i++)
    {
      MaxH = High[Highest(NULL,0,MODE_HIGH,period,i)];
      MinL = Low[Lowest(NULL,0,MODE_LOW,period,i)];
      price = (High[i]+Low[i])/2;

      if(MaxH-MinL == 0) Value = 0.33*2*(0-0.5) + 0.67*Value1;
      else Value = 0.33*2*((price-MinL)/(MaxH-MinL)-0.5) + 0.67*Value1;

      Value=MathMin(MathMax(Value,-0.999),0.999);

      if(1-Value == 0) ExtBuffer0[i]=0.5+0.5*Fish1;
      else ExtBuffer0[i]=0.5*MathLog((1+Value)/(1-Value))+0.5*Fish1;

      Value1=Value;
      Fish1=ExtBuffer0[i];
    }


   bool up=true;
   for(i=Bars; i>=0; i--)
     {
      current=ExtBuffer0[i];
      prev=ExtBuffer0[i+1];

      if (((current<0)&&(prev>0))||(current<0))   up= false;
      if (((current>0)&&(prev<0))||(current>0))   up= true;

      if(!up)
        {
         ExtBuffer2[i]=current;
         ExtBuffer1[i]=0.0;
        }

       else
         {
          ExtBuffer1[i]=current;
          ExtBuffer2[i]=0.0;
         }
     }

   return(0);
  }
Comments