ema cross bar
Download script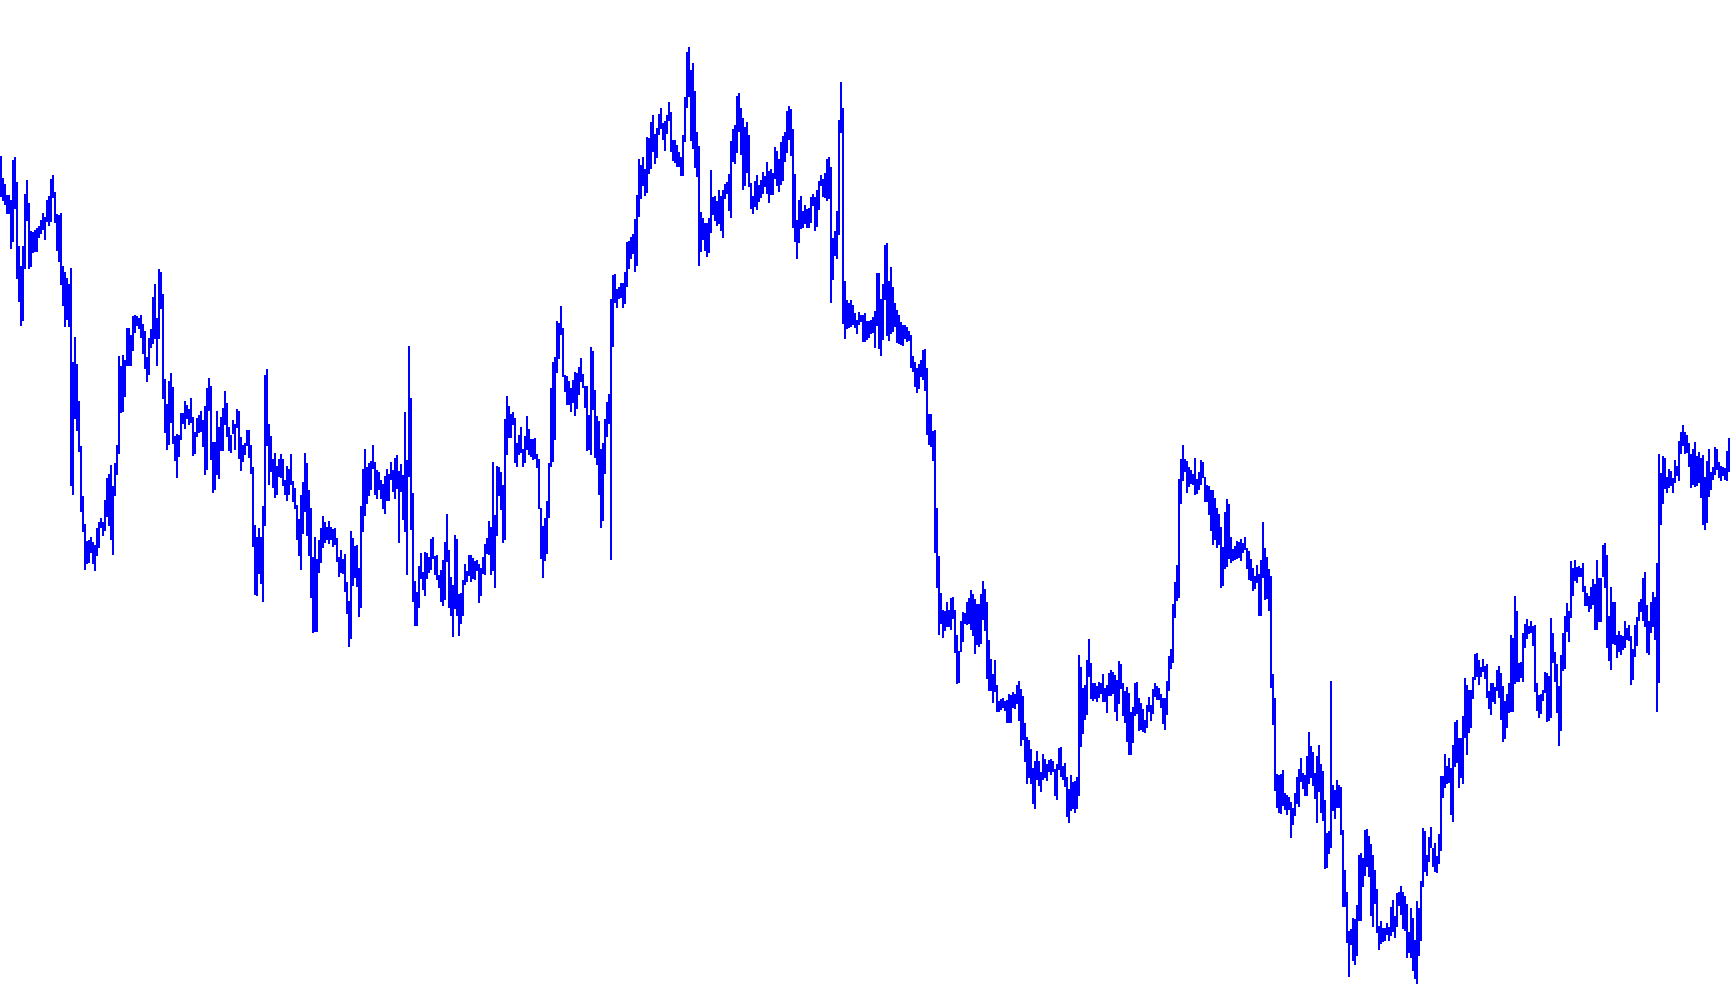
This technical tool is designed to provide a clear visual representation of market momentum by monitoring the relationship between two different types of moving averages. Its primary purpose is to help traders identify the current trend direction at a glance by highlighting the price action on your chart.
Core Mechanics
The script works by calculating two distinct "Exponential Moving Averages" (EMAs) simultaneously:
- The Fast Average: This reacts quickly to recent price changes, capturing short-term trends.
- The Slow Average: This moves more deliberately, filtering out minor market noise to show the broader trend.
How It Processes Data
The logic continuously compares these two averages against each other on every candle of the chart:
- Trend Detection: The script checks which moving average is currently positioned higher than the other.
- Bullish Signal (Upward Trend): When the Fast Average climbs above the Slow Average, the tool interprets this as upward momentum. In response, it creates a visual marker (a histogram bar) that originates from the bottom of the price candle and extends to the top.
- Bearish Signal (Downward Trend): Conversely, when the Fast Average falls below the Slow Average, the tool identifies downward pressure. It then adjusts the visual marker so that it appears to originate from the top of the price candle and extend downwards.
Visual Output
Instead of cluttering your screen with extra lines, the script simplifies this information into a color-coded histogram. By looking at the direction and "filling" of these bars, you can immediately see whether the market is leaning toward aซื้อ (buy) or sell sentiment based on the interaction between short-term speed and long-term stability.
//+------------------------------------------------------------------+
//| ema cross bar.mq4                                                |
//+------------------------------------------------------------------+

#property indicator_chart_window
#property indicator_buffers 2
#property indicator_color1 Blue
#property indicator_color2 Red

//---- input parameters
extern int fastperiod=8;
extern int slowperiod=21;

//---- buffers
double val1[];
double val2[];

//+------------------------------------------------------------------+
//| Custom indicator initialization function                         |
//+------------------------------------------------------------------+
int init()
  {
//---- indicator line
   IndicatorBuffers(2);
   SetIndexStyle(0,DRAW_HISTOGRAM,0,2);
   SetIndexStyle(1,DRAW_HISTOGRAM,0,2);
   SetIndexBuffer(0,val1);
   SetIndexBuffer(1,val2);
//----
   return(0);
  }
//+------------------------------------------------------------------+
//| ema cross                                                        |
//+------------------------------------------------------------------+
int start()
  {
   int i,shift,counted_bars=IndicatorCounted();
   double fastEma, slowEma;
   for (shift = counted_bars; shift>=0; shift--)
{

fastEma = iMA(NULL,0,fastperiod,0,MODE_EMA,PRICE_MEDIAN,i);
slowEma = iMA(NULL,0,slowperiod,0,MODE_EMA,PRICE_MEDIAN,i);
	val1[shift]=0;
	val2[shift]=0;
	if (fastEma>slowEma)
		{
		val1[shift]=Low[shift];
		val2[shift]=High[shift];
		}
	if (fastEma<slowEma)
		{
		val1[shift]=High[shift];
		val2[shift]=Low[shift];
		}

}
   return(0);
  }
//+------------------------------------------------------------------+
Comments