LinearRegSlope_v1
Download script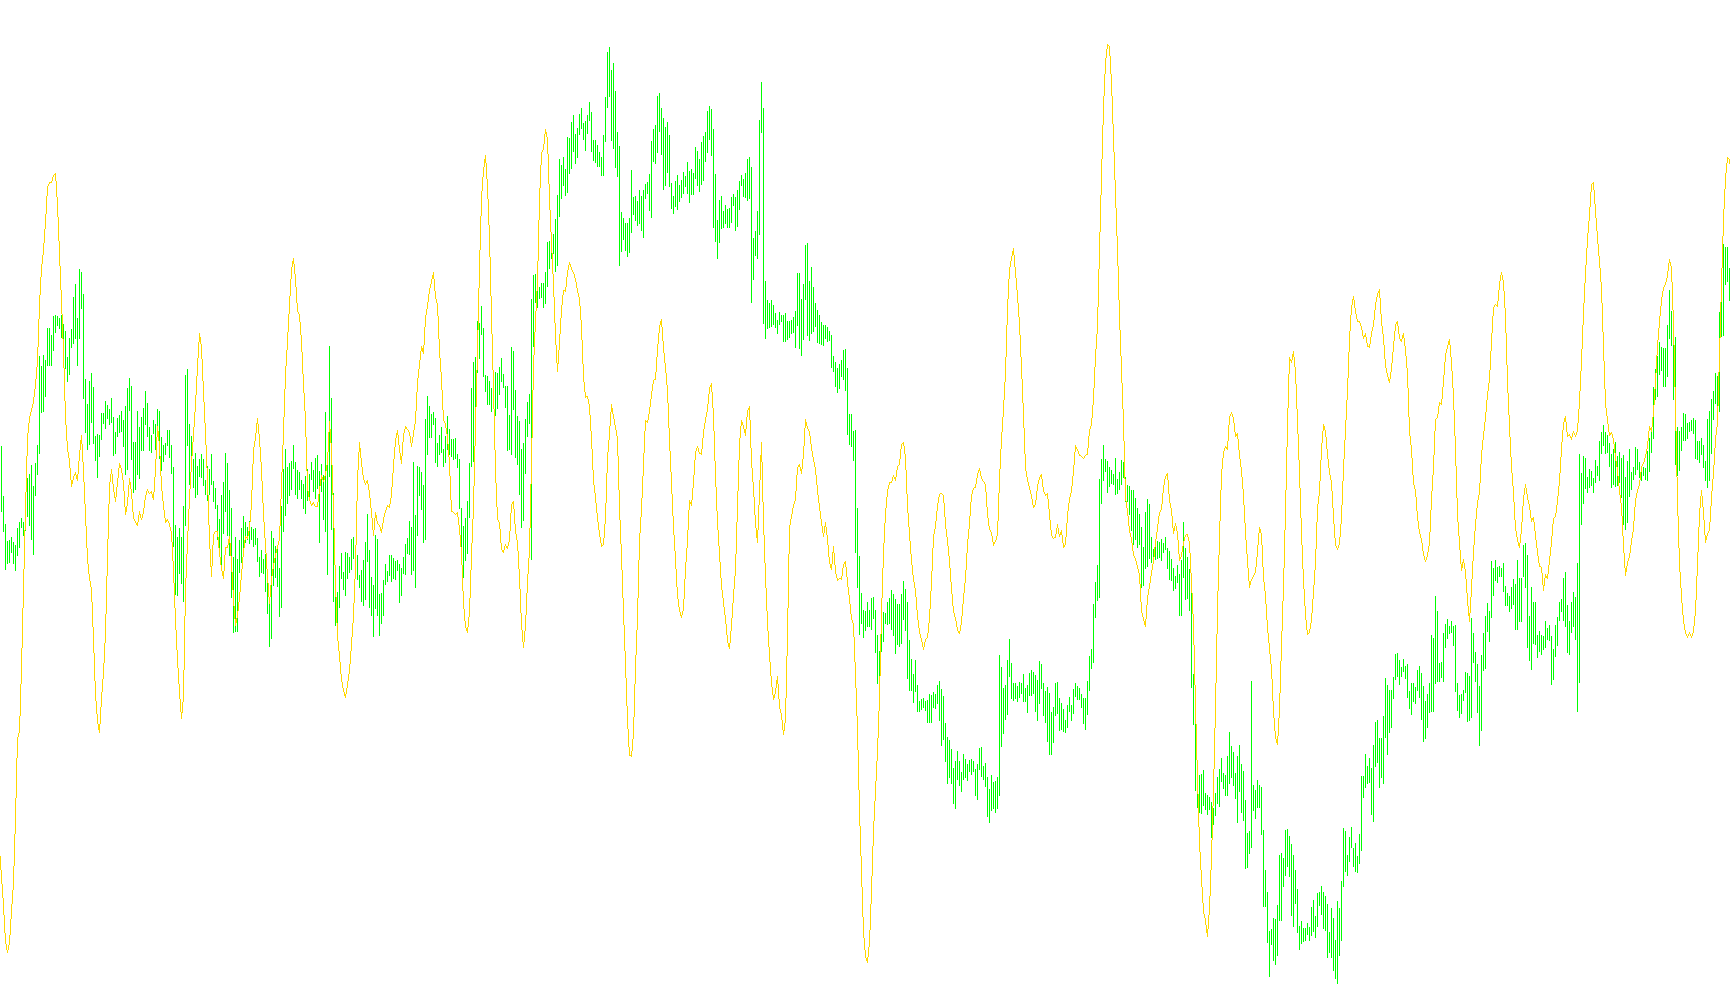
Overview
The LinearRegSlope indicator is a technical analysis tool designed to measure the "angle" or direction of price movement over a specific period. Rather than just showing where the price is, this script calculates how fast and in what direction the price is trending—effectively providing a mathematical representation of market momentum.
How It Works
The logic behind this script can be broken down into three main components:
1. Data Selection The user can define which specific type of price data the indicator should monitor. While "Close" price is the standard, the tool allows for flexibility by observing Open, High, Low, Median, or Weighted prices. This ensures that the slope calculation is tailored to the user's preferred market perspective.
2. The Measurement Window (Length) The "Length" parameter determines how much historical data the script looks at to determine the current trend. By looking at a specific number of previous bars (e.g., 14 periods), the script creates a snapshot of recent history. This helps smooth out minor "noise" or random fluctuations in the market to reveal the underlying direction.
3. Linear Regression Math The core of the script uses a statistical method called Linear Regression. Imagine drawing a straight line that best fits through a series of fluctuating price points; the slope of that line is what this indicator calculates.
- It calculates the sum of the prices within the chosen timeframe.
- It determines the relationship between those prices and their position in time.
- It then outputs a numerical value representing the steepness of that trend.
Interpreting the Results
The result is displayed as a line in a separate window at the bottom of your trading chart:
- Positive Value: Indicates an upward trend. The higher the number, the steeper the price is climbing.
- Negative Value: Indicates a downward trend. The lower (more negative) the number, the steeper the price is falling.
- Zero/Flat Line: Suggests that the market is moving sideways or lacks a clear directional trend within the chosen timeframe.
By providing a quantified view of momentum, this tool allows traders to see the strength of a trend more clearly than by looking at raw price action alone.
//+------------------------------------------------------------------+
//|                                            LinearRegSlope_v1.mq4 |
//|                                Copyright © 2006, TrendLaboratory |
//|            http://finance.groups.yahoo.com/group/TrendLaboratory |
//|                                   E-mail: igorad2003@yahoo.co.uk |
//+------------------------------------------------------------------+
#property copyright "Copyright © 2006, TrendLaboratory"
#property link      "http://finance.groups.yahoo.com/group/TrendLaboratory"


#property indicator_separate_window
#property indicator_buffers 1
#property indicator_color1 SkyBlue
#property indicator_width1 2

//---- input parameters
extern int     Price          =  0;  //Apply to Price(0-Close;1-Open;2-High;3-Low;4-Median price;5-Typical price;6-Weighted Close)
extern int     Length         = 14;  //Period of NonLagMA
//---- indicator buffers
double RegSlope[];
//+------------------------------------------------------------------+
//| Custom indicator initialization function                         |
//+------------------------------------------------------------------+
  int init()
  {
   SetIndexStyle(0,DRAW_LINE);
   SetIndexBuffer(0,RegSlope);

   string short_name;
//---- indicator line

   IndicatorDigits(MarketInfo(Symbol(),MODE_DIGITS));
//---- name for DataWindow and indicator subwindow label
   short_name="LinearRegSlope("+Length+")";
   IndicatorShortName(short_name);
   SetIndexLabel(0,"LinearRegSlope");
//----
   SetIndexDrawBegin(0,Length);
//----

   return(0);
  }

//+------------------------------------------------------------------+
//| LinearRegSlope_v1                                                      |
//+------------------------------------------------------------------+
int start()
{
   int    i,shift, counted_bars=IndicatorCounted(),limit;
   double price;
   if ( counted_bars > 0 )  limit=Bars-counted_bars;
   if ( counted_bars < 0 )  return(0);
   if ( counted_bars ==0 )  limit=Bars-Length-1;
   if ( counted_bars < 1 )
   for(i=1;i<Length;i++) RegSlope[Bars-i]=0;

   double SumBars = Length * (Length - 1) * 0.5;
   double SumSqrBars = (Length - 1.0) * Length * (2.0 * Length - 1.0) / 6.0;

   for(shift=limit;shift>=0;shift--)
   {
   double Sum1 = 0;
   for(i=0;i<=Length-1;i++) Sum1 += i*iMA(NULL,0,1,0,1,Price,i+shift);

   double SumY = 0;
   for(i=0;i<=Length-1;i++) SumY += iMA(NULL,0,1,0,1,Price,i+shift);

   double Sum2 = SumBars * SumY;

   double Num1 = Length * Sum1 - Sum2;
   double Num2 = SumBars * SumBars - Length * SumSqrBars;

   if( Num2 != 0 )
	RegSlope[shift] = 100*Num1/Num2;
   else
	RegSlope[shift] = 0;
   }

//----
	return(0);
}
Comments