R-Squared_v1
Download script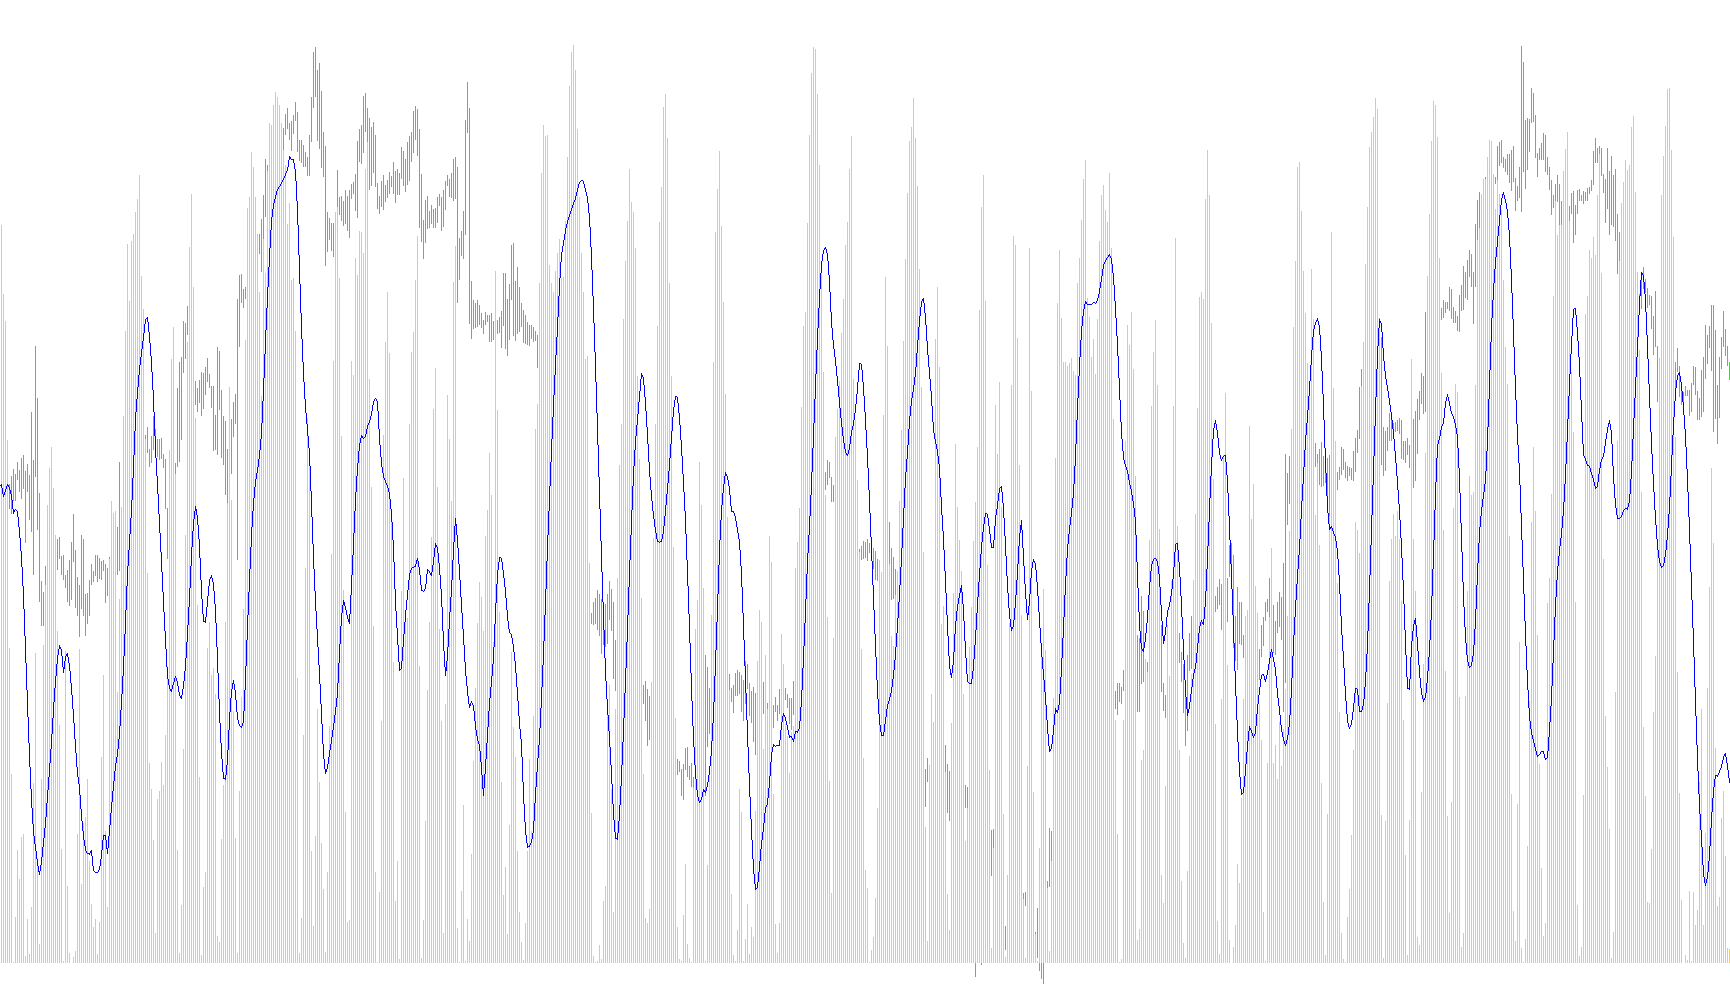
This indicator is designed to provide traders with a mathematical perspective on price trends by measuring the "strength" or "quality" of a movement. Instead of simply showing where the price is going, it evaluates how consistent and reliable that price action is over a specific period.
Core Logic and Functionality
The tool operates based on a statistical concept known as the R-Squared value. In plain terms, this represents how well a trend follows a straight line. Here is a breakdown of how the logic processes your data:
- Data Selection: You can choose which specific price point to analyze (such as the closing price, opening price, or highs and lows). The script then looks at a set number of previous bars (the "Length") to build its calculation.
- Trend Consistency Analysis: The logic calculates the relationship between time and price. It attempts to determine if the price is moving in a linear, predictable fashion.
- If the price is moving in a very steady, consistent direction, the indicator will yield a higher value.
- If the price action is erratic, sideways, or lacks a clear direction, the value will be lower.
- R-Squared Calculation: The script performs a series of mathematical summations to compare the actual price movements against a theoretical straight line. It produces a percentage-based score (represented as a histogram) that tells you how "reliable" the current trend is.
- Smoothing Mechanism: Because raw statistical data can sometimes be "noisy" or jump around too quickly, the script includes a secondary smoothing layer. This takes the R-Squared values and averages them over a specific period (the "Smooth" parameter), resulting in a smoother line that makes it easier to identify sustained trends without being distracted by minor price fluctuations.
How to Interpret the Visuals
The indicator appears in a separate window below your main price chart, providing two distinct visual cues:
- The Histogram (R-Squared): This shows the immediate statistical strength of the trend at each point in time.
- The Line (Smoothed): This provides a filtered view of the trend's stability. It helps you see the broader "big picture" of whether the market is currently in a high-quality trending phase or if it is becoming disorganized.
By using this tool, you are essentially filtering out the "noise" of the market to see how cleanly the price is moving, helping to identify periods of high trend integrity.
//+------------------------------------------------------------------+
//|                                                 R-Squared_v1.mq4 |
//|                                Copyright © 2006, TrendLaboratory |
//|            http://finance.groups.yahoo.com/group/TrendLaboratory |
//|                                   E-mail: igorad2003@yahoo.co.uk |
//+------------------------------------------------------------------+
#property copyright "Copyright © 2006, TrendLaboratory"
#property link      "http://finance.groups.yahoo.com/group/TrendLaboratory"


#property indicator_separate_window
#property indicator_buffers 2
#property indicator_color1 SkyBlue
#property indicator_color2 Tomato
#property indicator_width1 2
#property indicator_width2 1
#property indicator_minimum  -1
#property indicator_maximum 101
//---- input parameters
extern int     Price          =  0;  //Apply to Price(0-Close;1-Open;2-High;3-Low;4-Median price;5-Typical price;6-Weighted Close)
extern int     Length         = 14;  //Period of indicator
extern int     Smooth         = 14;  //Period of smoothing
//---- indicator buffers
double RSquared[];
double Smoothed[];
//+------------------------------------------------------------------+
//| Custom indicator initialization function                         |
//+------------------------------------------------------------------+
  int init()
  {
   SetIndexStyle(0,DRAW_HISTOGRAM);
   SetIndexBuffer(0,RSquared);
   SetIndexStyle(1,DRAW_LINE);
   SetIndexBuffer(1,Smoothed);
   string short_name;
//---- indicator line
   IndicatorDigits(MarketInfo(Symbol(),MODE_DIGITS));
//---- name for DataWindow and indicator subwindow label
   short_name="R-Squared("+Length+")";
   IndicatorShortName(short_name);
   SetIndexLabel(0,"R-Squared");
   SetIndexLabel(1,"Smoothed");
//----
   SetIndexDrawBegin(0,Length+Smooth);
   SetIndexDrawBegin(1,Length+Smooth);
//----

   return(0);
  }

//+------------------------------------------------------------------+
//| R-Squared_v1                                                      |
//+------------------------------------------------------------------+
int start()
{
   int    i,shift, counted_bars=IndicatorCounted(),limit;
   double price;
   if ( counted_bars > 0 )  limit=Bars-counted_bars;
   if ( counted_bars < 0 )  return(0);
   if ( counted_bars ==0 )  limit=Bars-Length-1;
   if ( counted_bars < 1 )
   for(i=1;i<Length;i++) {RSquared[Bars-i]=0;Smoothed[Bars-i]=0;}

   double SumX = 0;
   for(i=0;i<=Length-1;i++) SumX += i+1;

   double SumX2 = 0;
   for(i=0;i<=Length-1;i++) SumX2 += (i+1)*(i+1);

   for(shift=limit;shift>=0;shift--)
   {
   double SumY = 0;
   for(i=0;i<=Length-1;i++) SumY += iMA(NULL,0,1,0,1,Price,i+shift);

   double SumY2 = 0;
   for(i=0;i<=Length-1;i++) SumY2 += MathPow(iMA(NULL,0,1,0,1,Price,i+shift),2);

   double SumXY = 0;
   for(i=0;i<=Length-1;i++) SumXY += (i+1)*iMA(NULL,0,1,0,1,Price,i+shift);


   double Q1 = SumXY - SumX*SumY/Length;
   double Q2 = SumX2 - SumX*SumX/Length;
   double Q3 = SumY2 - SumY*SumY/Length;

   if( Q2*Q3 != 0 )
	RSquared[shift] = 100*Q1*Q1/(Q2*Q3);
   else
	RSquared[shift] = 0;

   double SumR = 0;
   for(i=0;i<=Smooth-1;i++) SumR += RSquared[shift+i];
   Smoothed[shift]=SumR/Smooth;
   }
//----
	return(0);
}
Comments