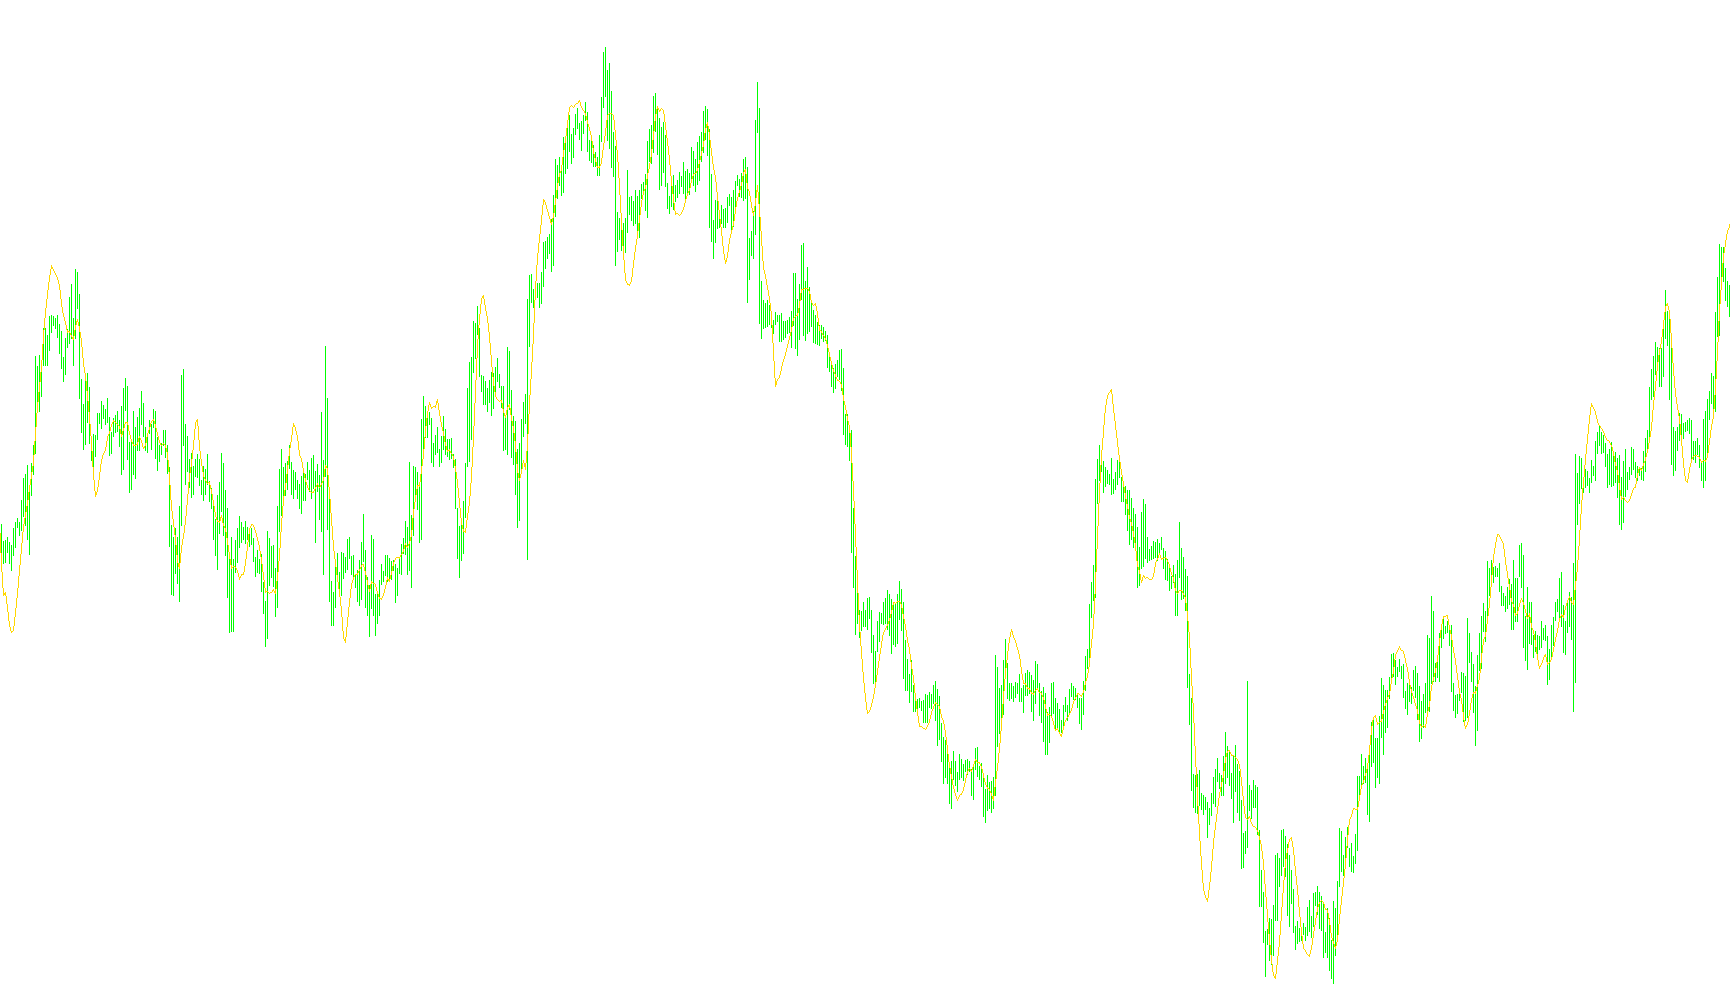
This tool is a custom technical analysis indicator designed to help traders visualize momentum and price trends on their charts. It functions by calculating the relationship between different types of moving averages to identify whether a market's strength is increasing or decreasing.
Core Mechanics
The logic operates through three primary components that work together to provide a comprehensive view of price action:
1. The MACD Line (Main Momentum) The script first looks at two different "Moving Averages"—short-term and long-term—which are essentially smoothed versions of the market's closing prices. By calculating the difference between these two averages, the tool identifies the gap between immediate price movement and the broader trend. This result is then adjusted by the current closing price to create a primary momentum line.
2. The Signal Line (Trend Smoothing) To filter out "noise" or minor market fluctuations, the script takes the results of the MACD calculation and applies a third smoothing process. This creates a secondary line that acts as a guide, showing the average direction of the momentum over time. When the main momentum line crosses this signal line, it often suggests a potential shift in trend direction.
3. The Histogram (Visual Momentum) The tool also generates a histogram which provides a visual representation of the distance between the momentum and the signal lines. By adding this difference to the closing price, it allows traders to see at a glance how "stretched" or "compressed" the current price movement is relative to its recent history.
How It Works Together
Instead of just showing you where the price is, this script analyzes how fast the price is moving and whether that speed is accelerating or slowing down. By using three distinct layers of calculation—short-term trends, long-term averages, and smoothing filters—it aims to provide a more nuanced view of market dynamics than a single indicator could offer alone.
//---- indicator settings
#property  indicator_chart_window
#property  indicator_buffers 3
#property  indicator_color1  Silver
#property  indicator_color2  Red
#property  indicator_color3  Blue
#property  indicator_width1  2
//---- indicator parameters
extern int FastEMA=12;
extern int SlowEMA=26;
extern int SignalSMA=9;
//---- indicator buffers
double     MacdBuffer[];
double     SignalBuffer[];
double     HistoBuffer[];

//+------------------------------------------------------------------+
//| Custom indicator initialization function                         |
//+------------------------------------------------------------------+
int init()
  {
//---- drawing settings
   SetIndexStyle(0,DRAW_LINE);
   SetIndexStyle(1,DRAW_NONE);
   SetIndexStyle(2,DRAW_NONE);
   SetIndexDrawBegin(1,SignalSMA);
   IndicatorDigits(Digits+1);
//---- indicator buffers mapping
   SetIndexBuffer(0,MacdBuffer);
   SetIndexBuffer(1,SignalBuffer);
   SetIndexBuffer(2,HistoBuffer);
//---- name for DataWindow and indicator subwindow label
   IndicatorShortName("MACD("+FastEMA+","+SlowEMA+","+SignalSMA+")    !! :)");
   SetIndexLabel(0,"MACD YO");
   SetIndexLabel(1,"Signal YO");
   SetIndexLabel(2,"H I S T O :):)");
//---- initialization done
   return(0);
  }
//+------------------------------------------------------------------+
//| Moving Averages Convergence/Divergence                           |
//+------------------------------------------------------------------+
int start()
  {
   int limit;
   int counted_bars=IndicatorCounted();
//---- last counted bar will be recounted
   if(counted_bars>0) counted_bars--;
   limit=Bars-counted_bars;
//---- macd counted in the 1-st buffer
   for(int i=0; i<limit; i++)
      MacdBuffer[i]=Close[i]+(iMA(NULL,0,FastEMA,0,MODE_EMA,PRICE_CLOSE,i)-iMA(NULL,0,SlowEMA,0,MODE_EMA,PRICE_CLOSE,i));
//---- signal line counted in the 2-nd buffer
   for(i=0; i<limit; i++)
      SignalBuffer[i]=iMAOnArray(MacdBuffer,Bars,SignalSMA,0,MODE_SMA,i);
//---- histogram line counted in the 3-nd buffer
   for(i=0; i<limit; i++)
      HistoBuffer[i]=Close[i]+(MacdBuffer[i]-SignalBuffer[i]);

   for(i=0; i<limit; i++)
      MacdBuffer[i]=iMAOnArray(HistoBuffer,Bars,SignalSMA,0,MODE_SMA,i);
//---- done
   return(0);
  }
//+------------------------------------------------------------------+
Comments