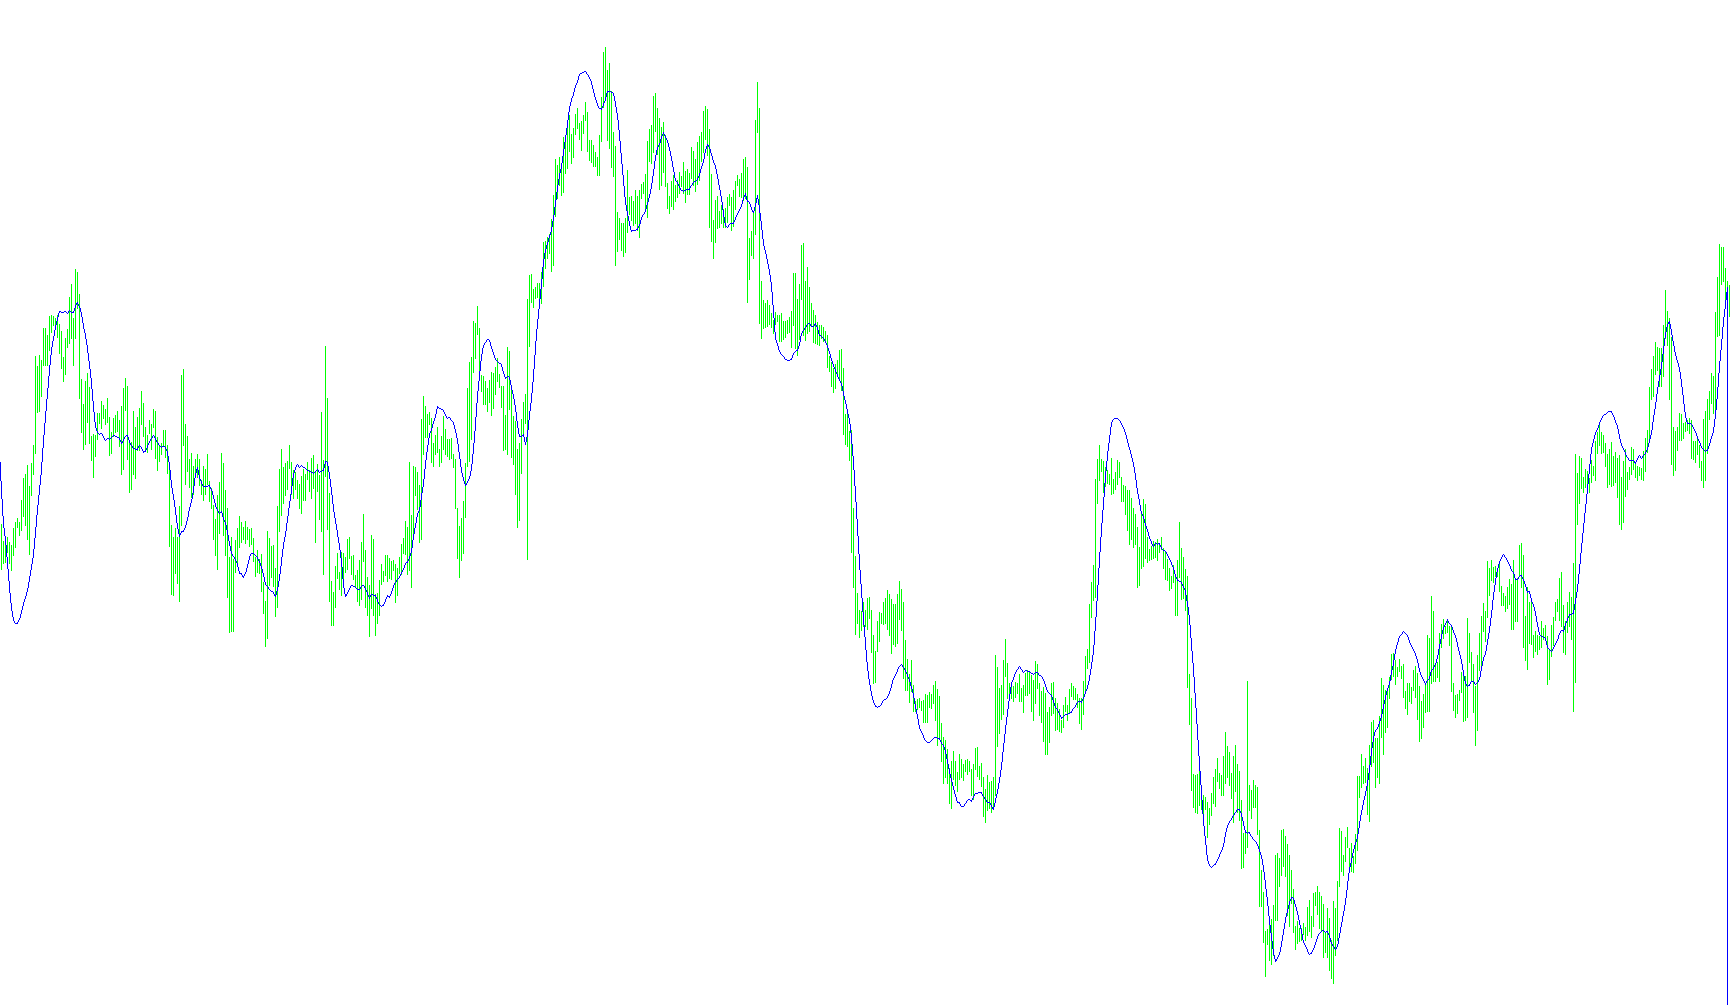
This tool is designed to help traders visualize momentum and the relationship between different price averages on a trading chart. It functions by calculating specific mathematical trends and comparing them to identify shifts in market direction.
Core Components
The script works by processing three distinct layers of data to provide a comprehensive view of market activity:
1. The Momentum Base (MACD) The tool begins by looking at two different types of moving averages—one that reacts quickly to price changes and one that tracks the broader trend more slowly. By calculating the difference between these two, it identifies whether the current price speed is accelerating or decelerating. This serves as the foundation for understanding the strength of the market's current move.
2. The Signal Line To smooth out the "noise" of the initial momentum data, the script takes the results from the first step and applies a secondary moving average to them. This creates a "Signal Line." Traders use this to identify turning points; when the primary momentum crosses over this signal line, it often suggests a potential change in the market's trend.
3. The Histogram and Final Smoothing The script then calculates a "Histogram" value by comparing the current closing price against the sum of the previous calculations. Finally, it applies one last layer of smoothing to these histogram values. This multi-step process is intended to filter out minor fluctuations, allowing for a clearer view of whether the market is gaining or losing steam over time.
How it Works for the User
Instead of just showing you raw prices, this script translates price action into three visual elements:
- The Primary Line: Represents the core momentum.
- The Signal Line: Acts as a guide to help identify potential entry or exit points based on trend crossovers.
- The Histogram: Provides a visual representation of the remaining difference between the current price and the moving averages, helping to gauge the intensity of a move.
By combining these three layers, the tool provides a more nuanced perspective on market trends than a single price line could offer alone.
//---- indicator settings
#property  indicator_chart_window
#property  indicator_buffers 3
#property  indicator_color1  Silver
#property  indicator_color2  Red
#property  indicator_color3  Blue
#property  indicator_width1  2
//---- indicator parameters
extern int FastEMA=12;
extern int SlowEMA=26;
extern int SignalSMA=9;
//---- indicator buffers
double     MacdBuffer[];
double     SignalBuffer[];
double     HistoBuffer[];

//+------------------------------------------------------------------+
//| Custom indicator initialization function                         |
//+------------------------------------------------------------------+
int init()
  {
//---- drawing settings
   SetIndexStyle(0,DRAW_NONE);
   SetIndexStyle(1,DRAW_LINE);
   SetIndexStyle(2,DRAW_NONE);
   SetIndexDrawBegin(1,SignalSMA);
   IndicatorDigits(Digits+1);
//---- indicator buffers mapping
   SetIndexBuffer(0,MacdBuffer);
   SetIndexBuffer(1,SignalBuffer);
   SetIndexBuffer(2,HistoBuffer);
//---- name for DataWindow and indicator subwindow label
   IndicatorShortName("MACD("+FastEMA+","+SlowEMA+","+SignalSMA+")    !! :)");
   SetIndexLabel(0,"MACD YO");
   SetIndexLabel(1,"Signal YO");
   SetIndexLabel(2,"H I S T O :):)");
//---- initialization done
   return(0);
  }
//+------------------------------------------------------------------+
//| Moving Averages Convergence/Divergence                           |
//+------------------------------------------------------------------+
int start()
  {
   int limit;
   int counted_bars=IndicatorCounted();
//---- last counted bar will be recounted
   if(counted_bars>0) counted_bars--;
   limit=Bars-counted_bars;
//---- macd counted in the 1-st buffer
   for(int i=0; i<limit; i++)
      MacdBuffer[i]=Close[i]+(iMA(NULL,0,FastEMA,0,MODE_EMA,PRICE_CLOSE,i)-iMA(NULL,0,SlowEMA,0,MODE_EMA,PRICE_CLOSE,i));
//---- signal line counted in the 2-nd buffer
   for(i=0; i<limit; i++)
      SignalBuffer[i]=iMAOnArray(MacdBuffer,Bars,SignalSMA,0,MODE_SMA,i);
//---- histogram line counted in the 3-nd buffer
   for(i=0; i<limit; i++)
      HistoBuffer[i]=Close[i]-(MacdBuffer[i]+SignalBuffer[i]);

   for(i=0; i<limit; i++)
      MacdBuffer[i]=iMAOnArray(HistoBuffer,Bars,SignalSMA,0,MODE_SMA,i);

//---- done
   return(0);
  }
//+------------------------------------------------------------------+
Comments